Navigation and Interface Overview
Dashboard: Comprehensive onboarding for users.
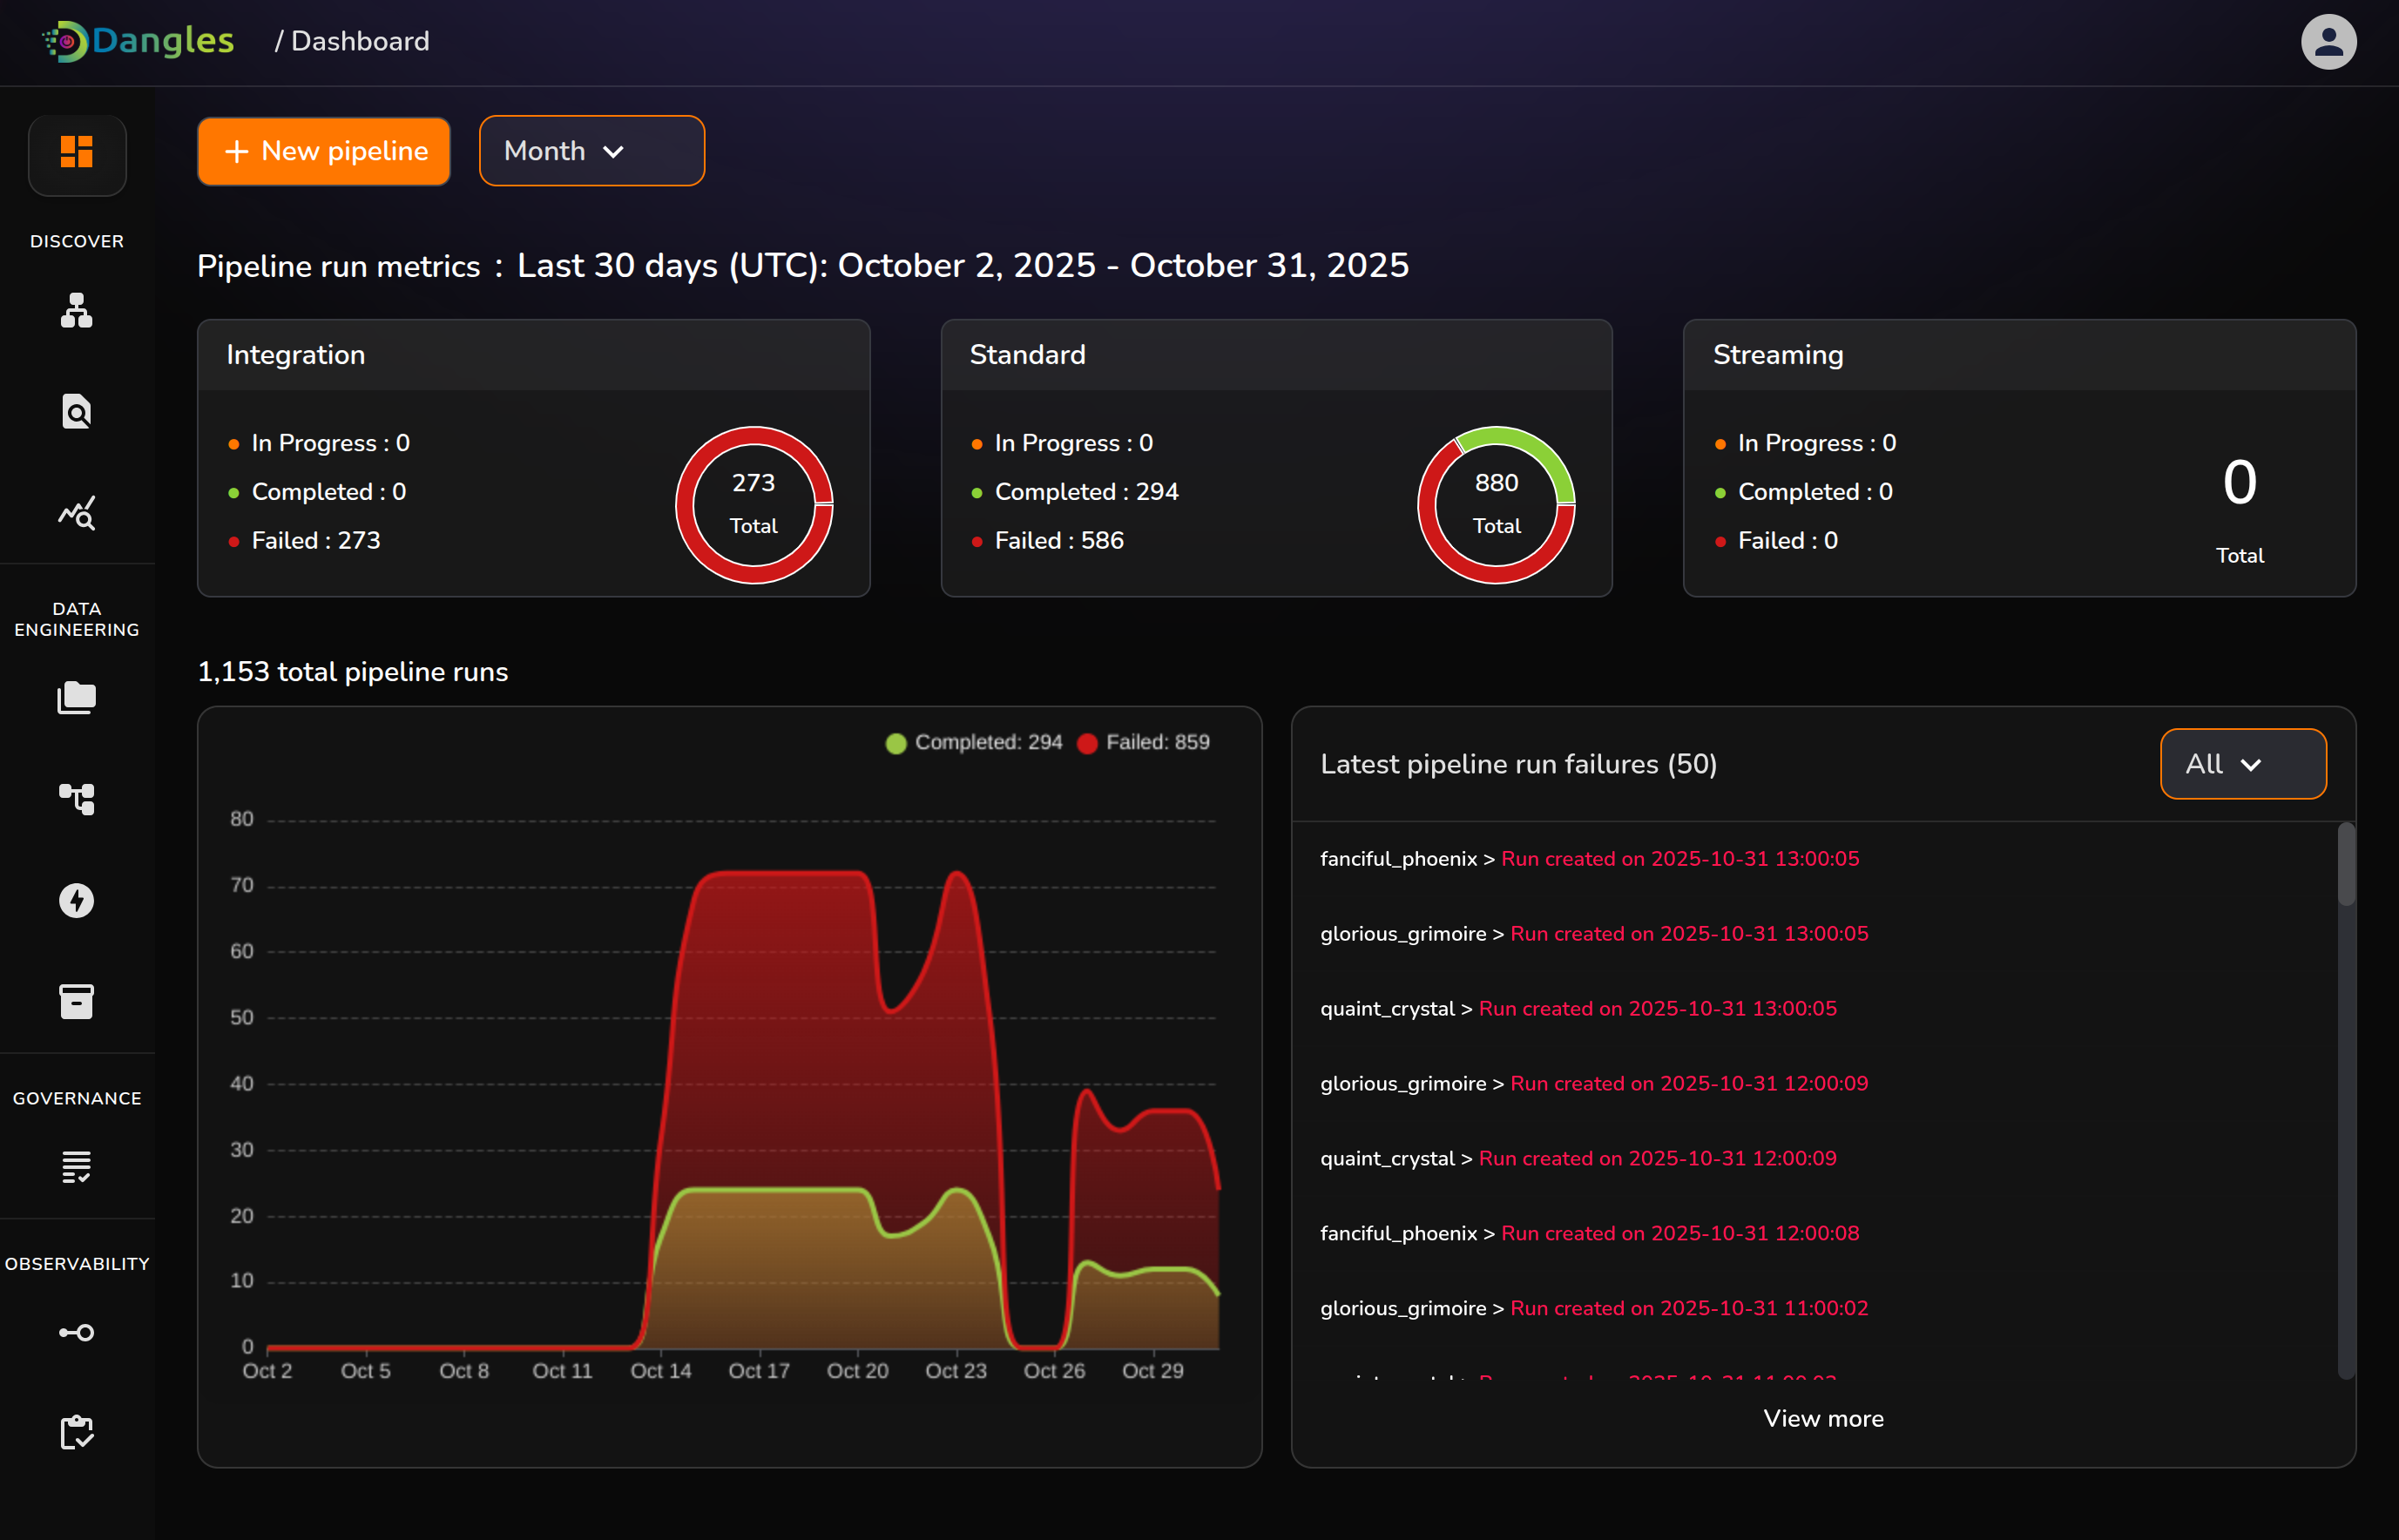
The Navigation & Onboarding page serves as the first point of interaction for users logging into the platform. It introduces key features, displays live pipeline statuses, and provides direct navigation to critical monitoring and management sections.
Pipeline Status: Shows each pipeline’s status, last run time, throughput, and error rate. Color indicators highlight running, warning, or failed states.
Monitoring Panel: Summarizes CPU and memory usage, queue latency, worker activity, and recent alerts.
Activity Feed: Lists recent events such as pipeline runs, alerts, and configuration updates.
Quick Navigation: Provides direct links to Pipelines, Monitoring, Logs, and Settings.