Core Features and Functionalities:
D-Angles is an AI-powered Data engineering platform supports and enhances data teams with AI intelligence and low-code capabilities. User Flow of the platform is designed to accommodate the data teams day to day responsibilities:
Discovery Module:
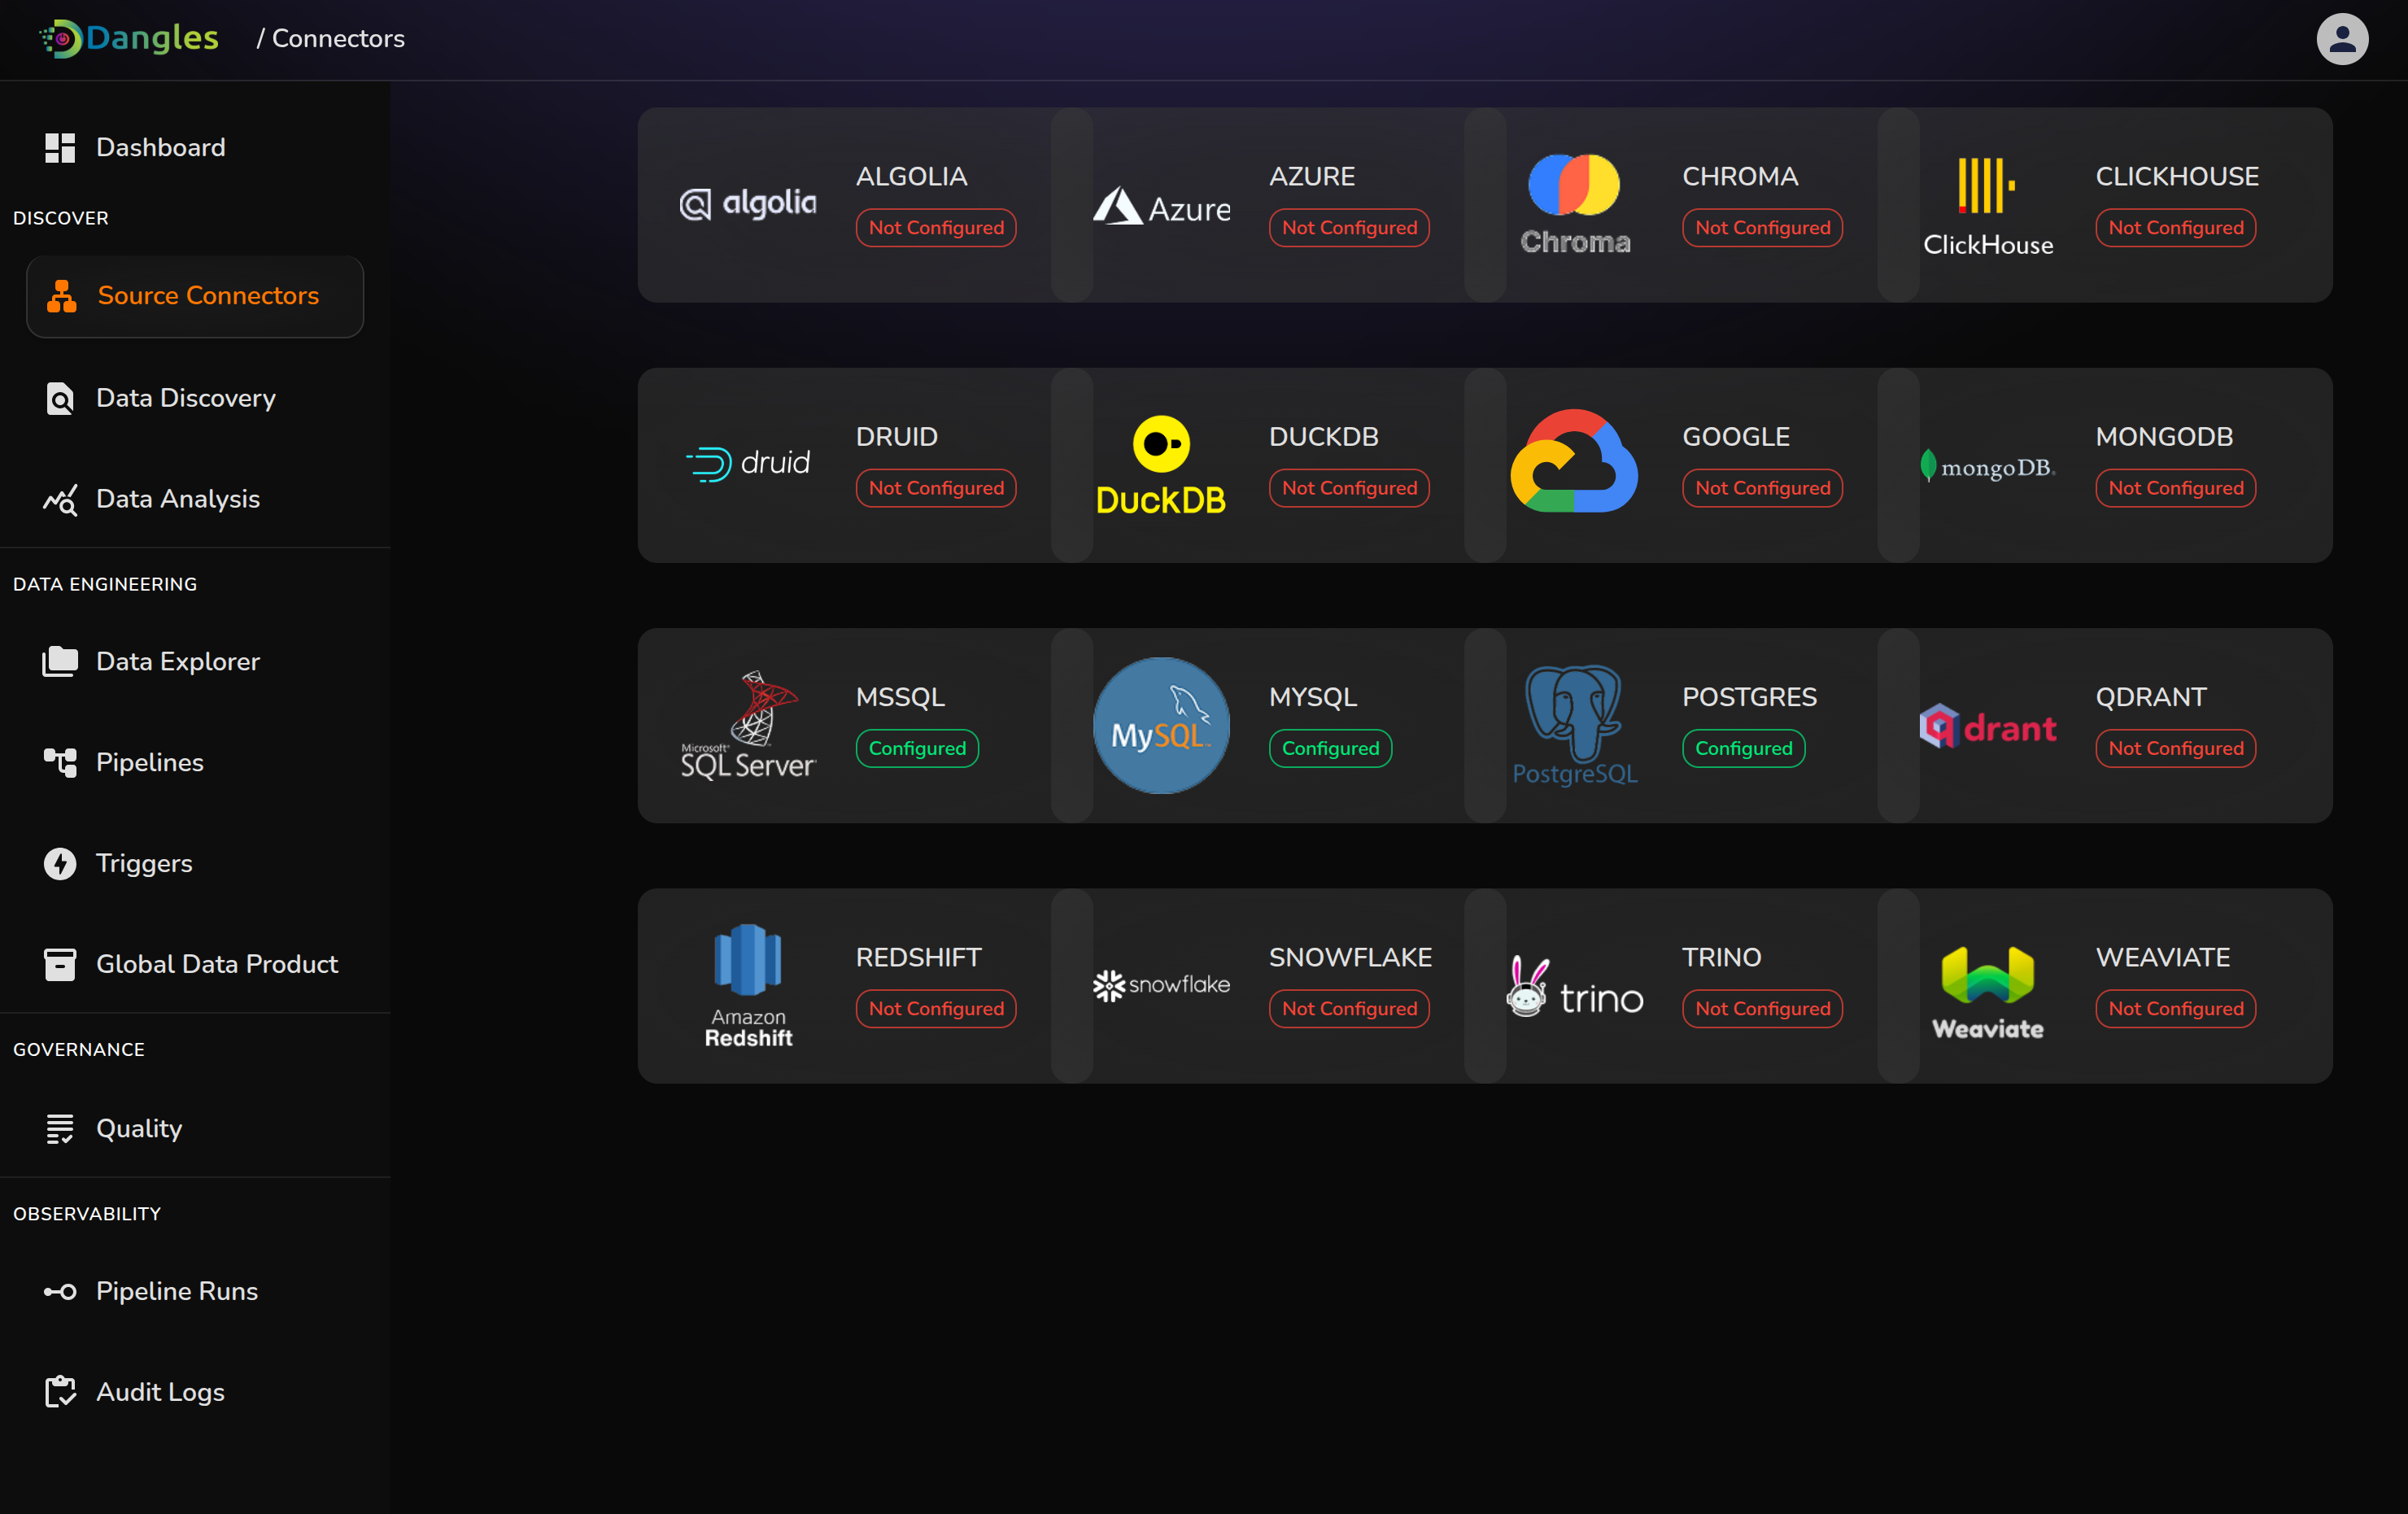
- Source Connectors: Support more than 200+ sources both as source and target destination. This include databases like MySQL , postgreSQL, MongoDB etc, warehouses like Redshift, Snowflake etc and data lakes like S3, Azure Data Lake etc. and many more. Giving user flexibility to use multiple sources at once.
- ER diagram generation for Relational Databases and Knowledge Graphs for schemtic and sematic relationship mapping by evaluating the metadata of the database. This diagram can be downloaded and provided with 3 different themes(Forest, Dark and Neutral) for better user visual experience.
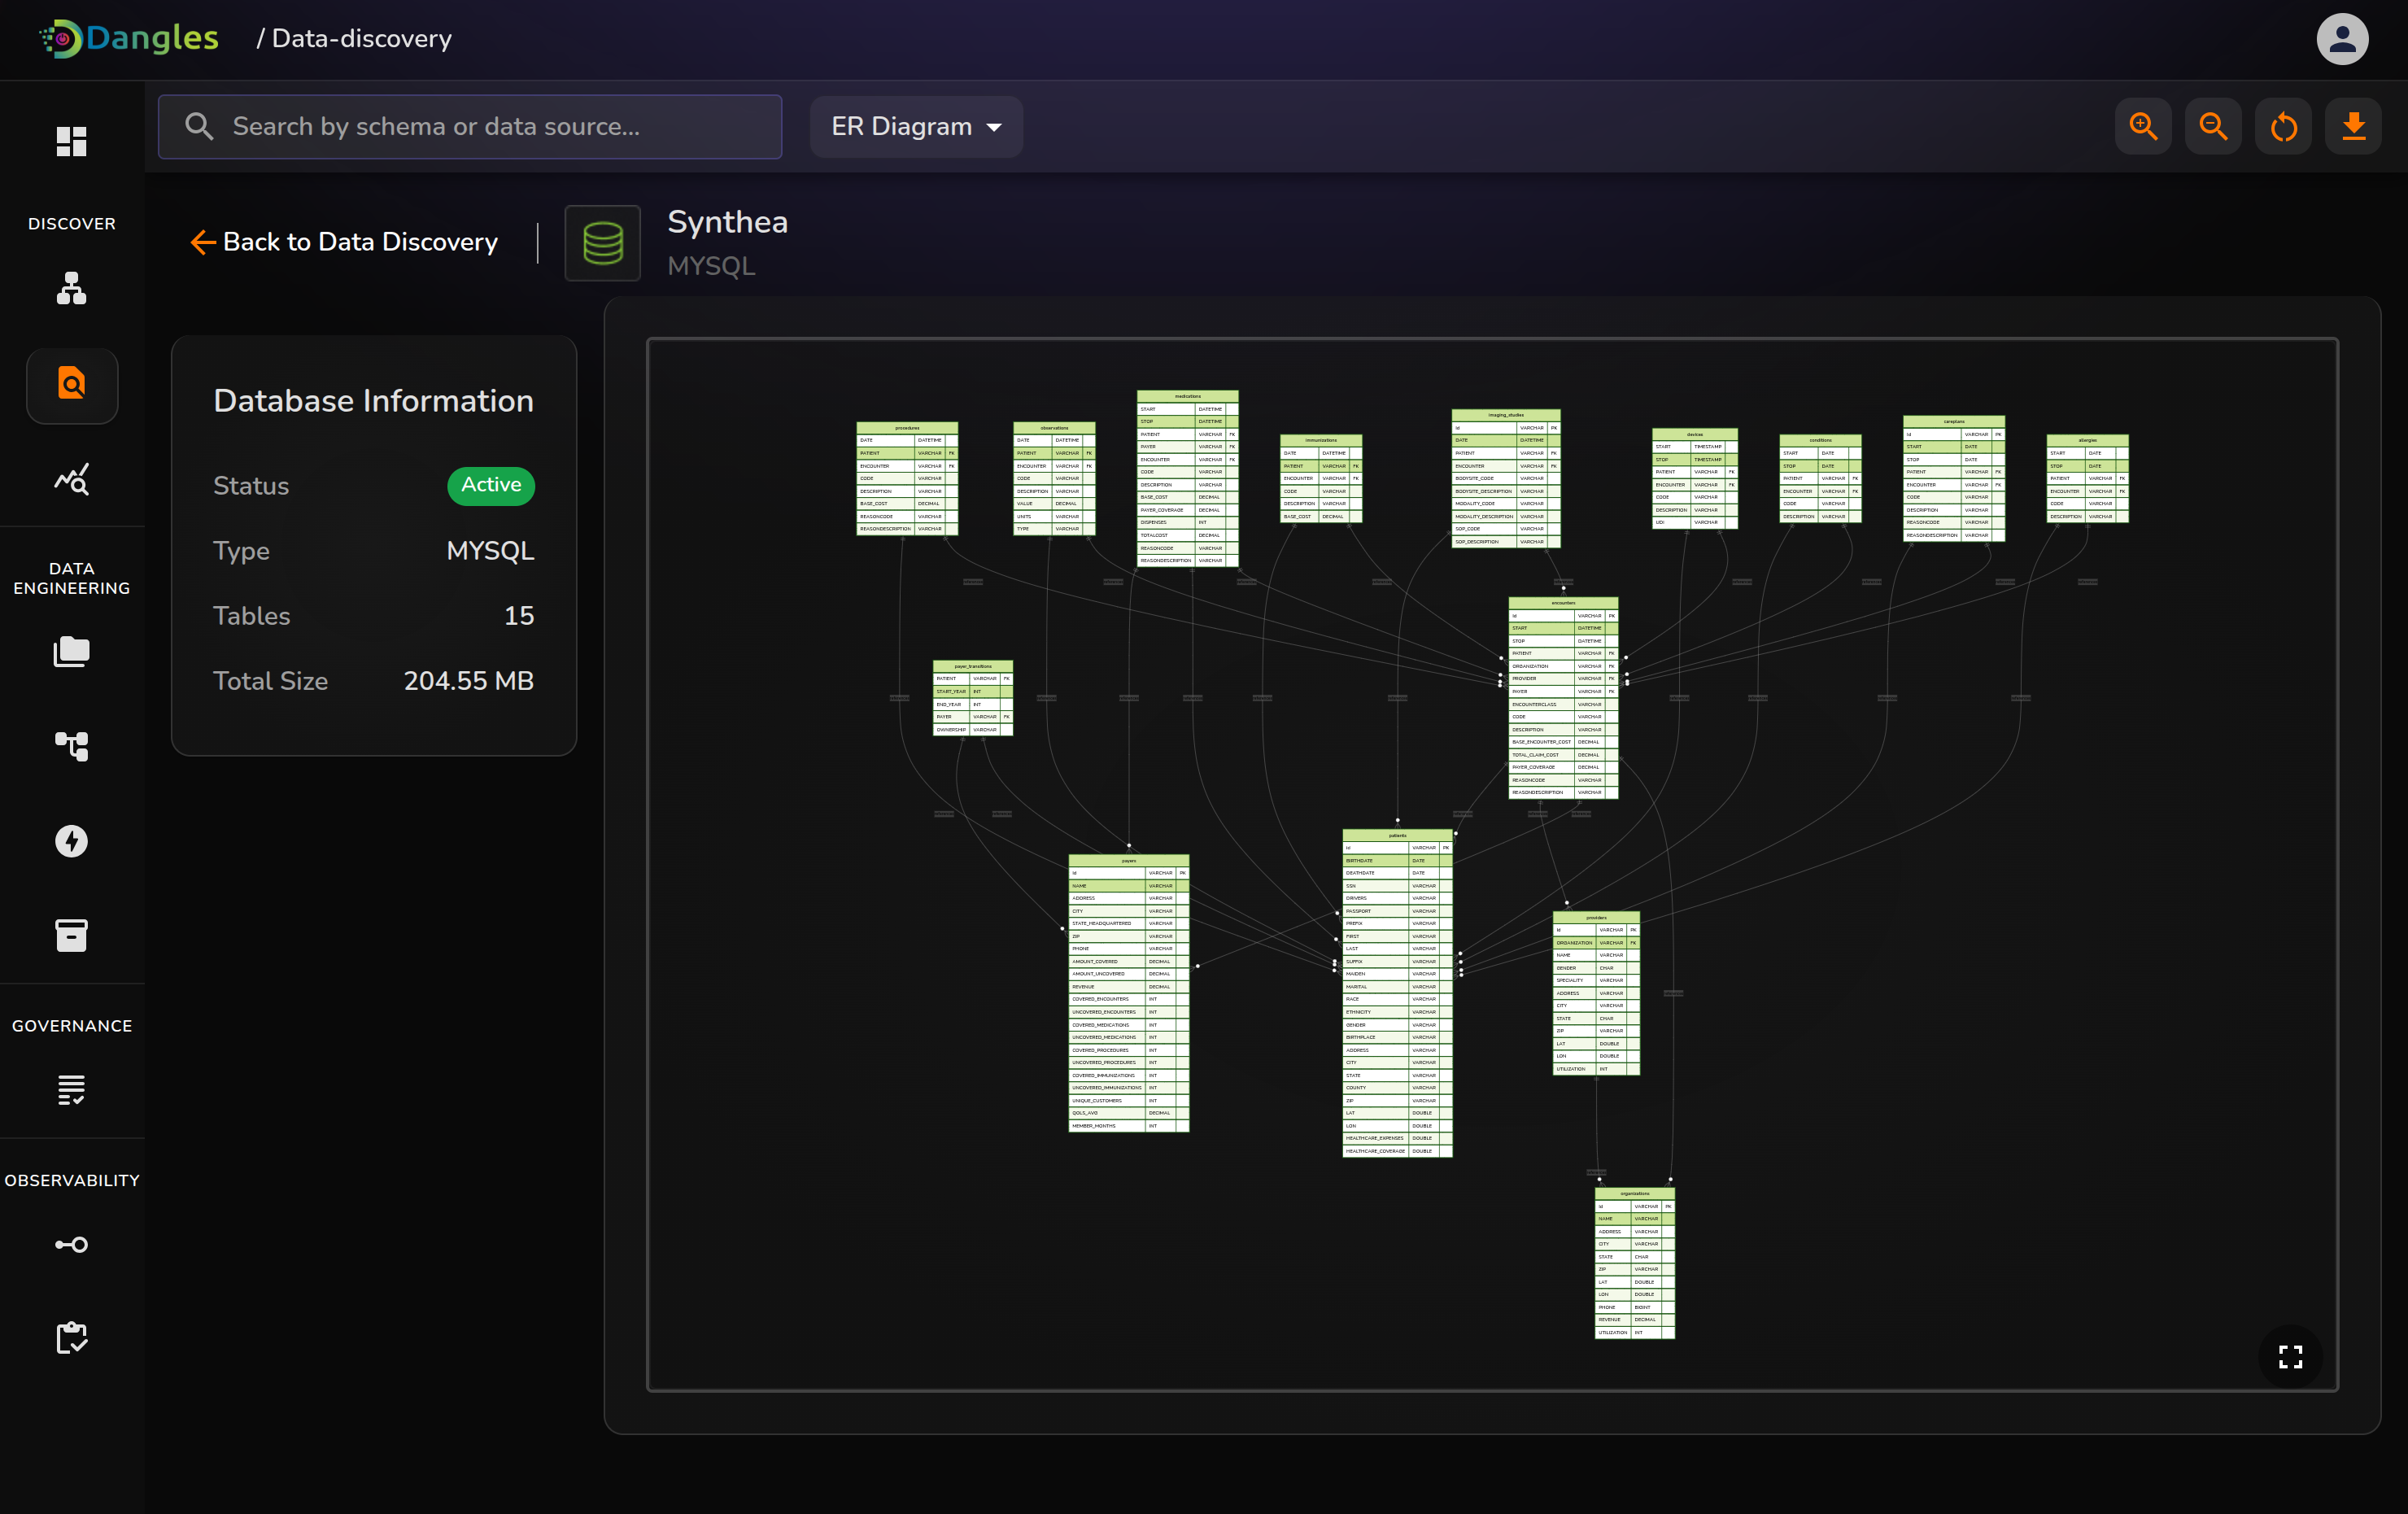
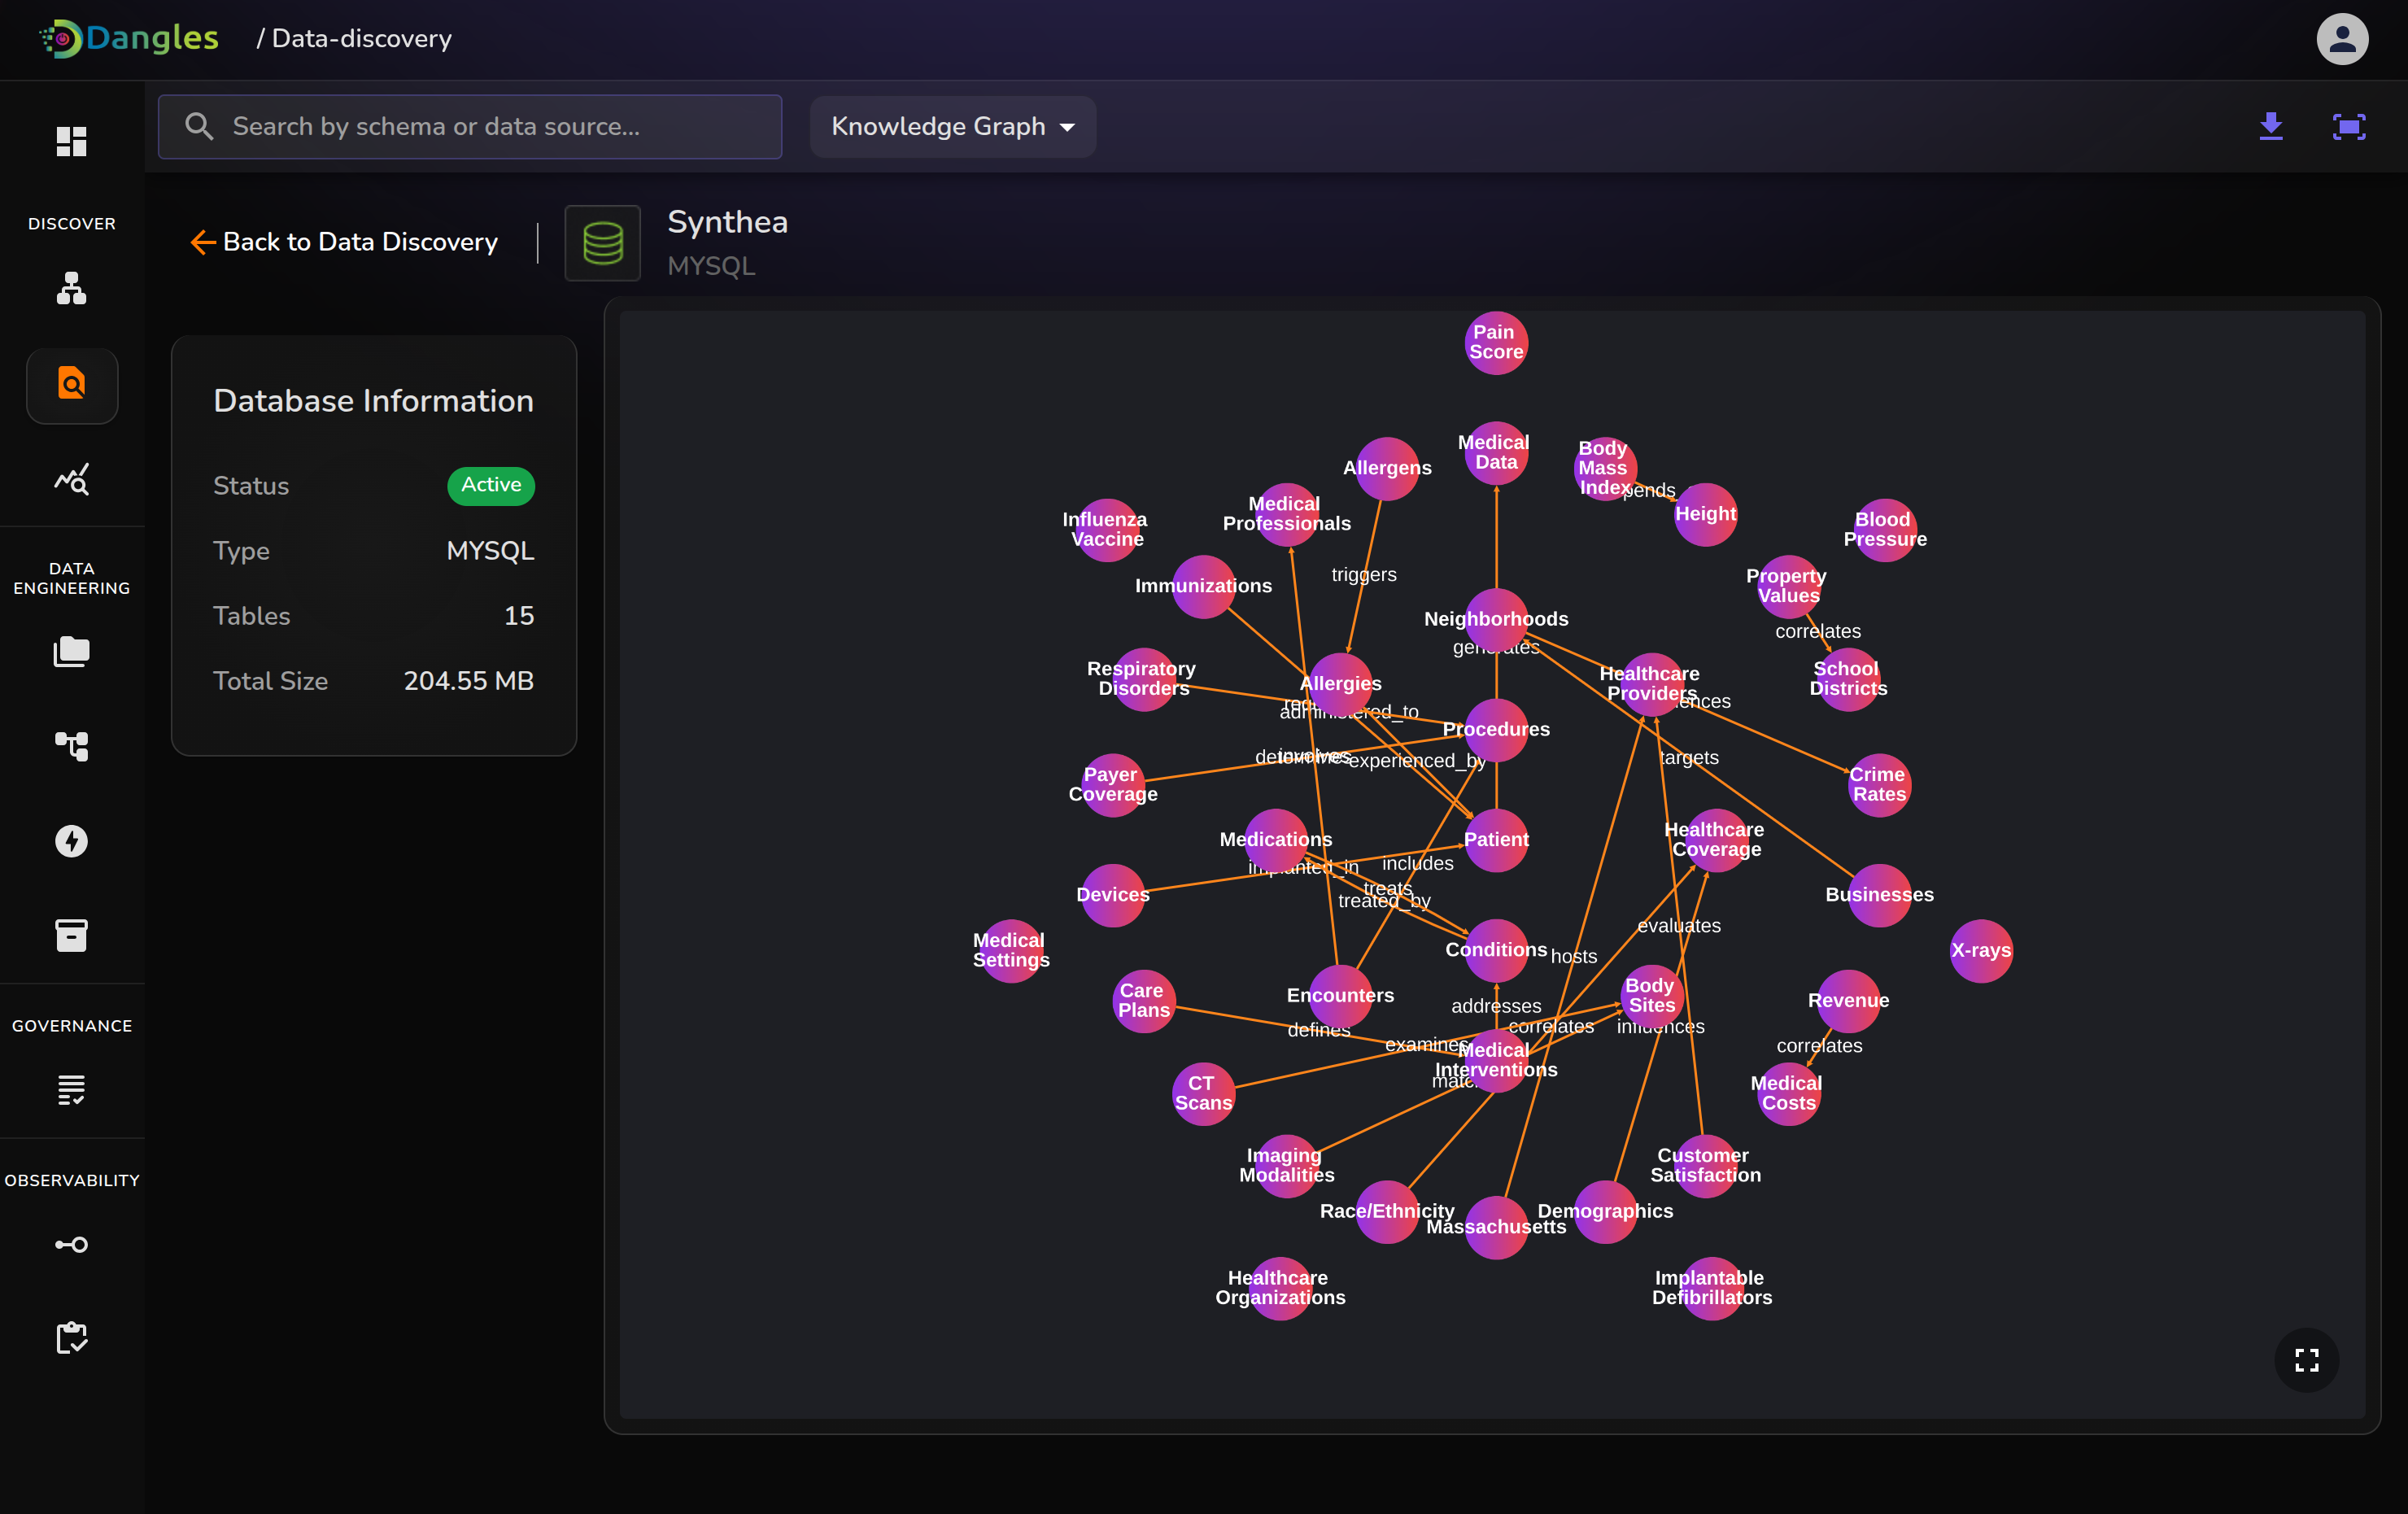
ER Diagram and Knowledge Graph visualizations for relational and semantic mapping.
Data Analysis Module:
In-depth Data Analysis for both categorical and numerical columns.
1. Overview and Profiling : general overview of column structure, null count, IQR values , unique values etc.
2. Distribution analysis: information on data spread using histogram, KDE plot, QQ plot, Box plot(can identify outliers using box plot).
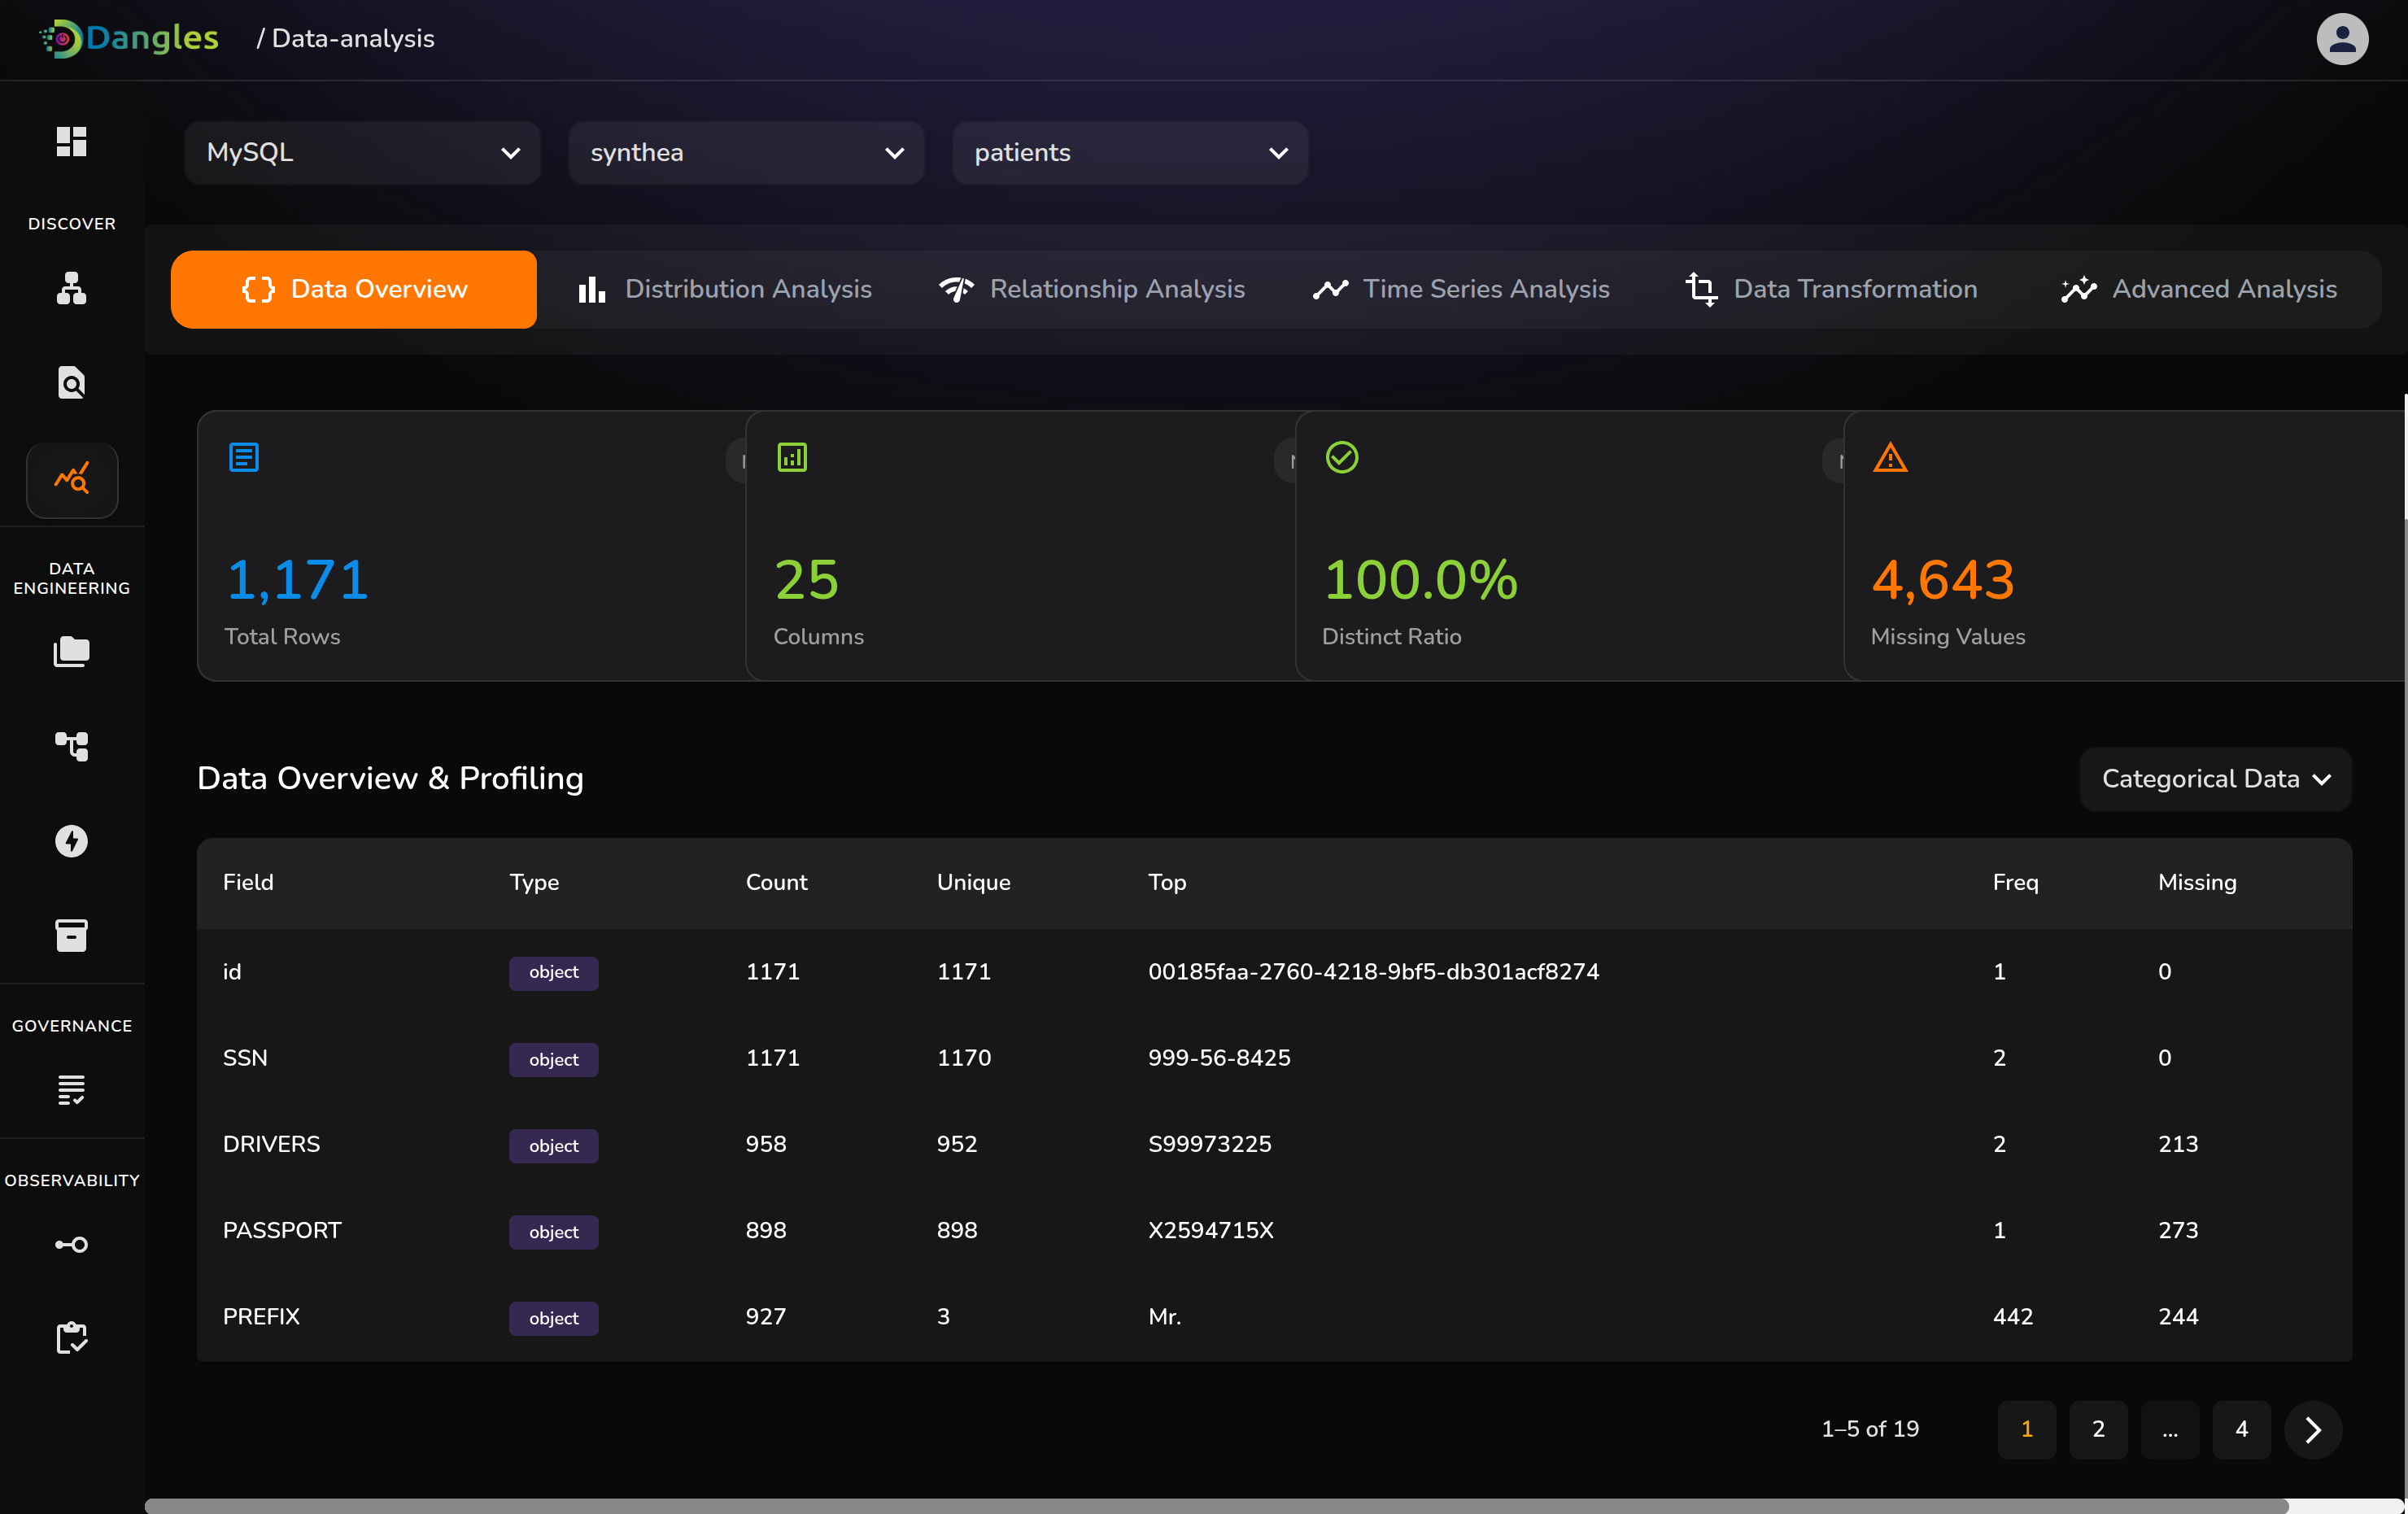
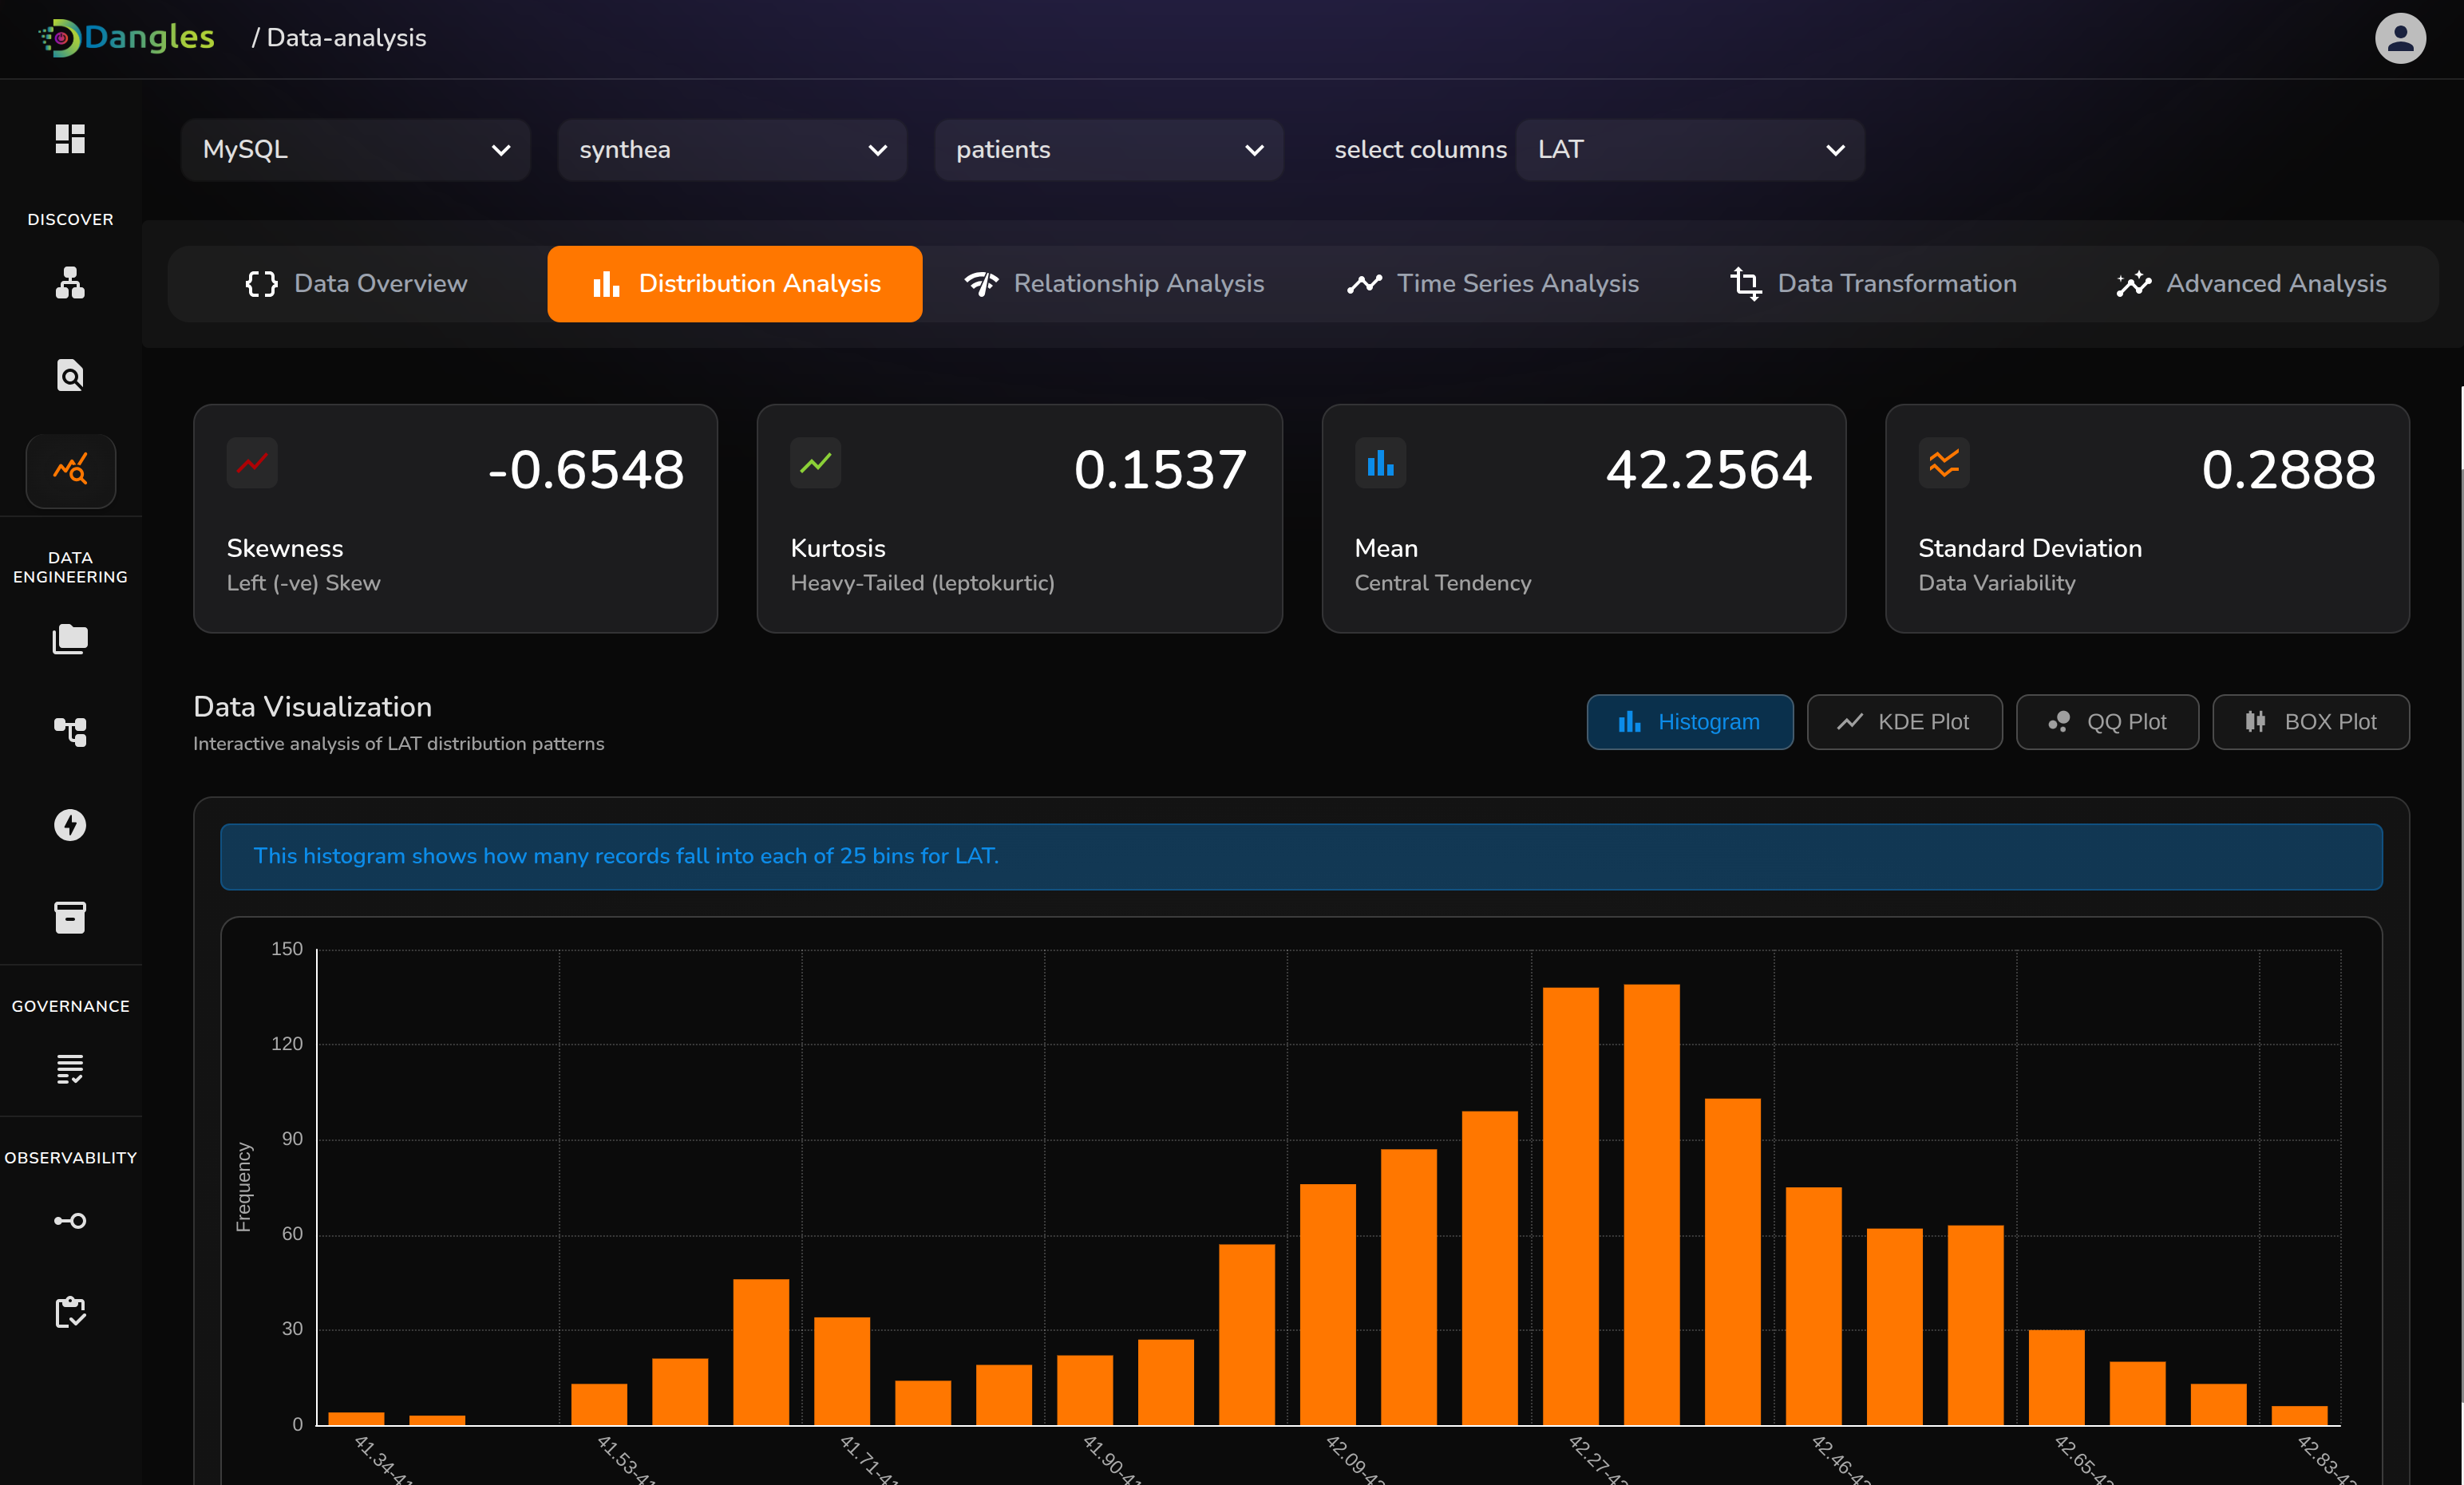
Overview and Data Distribution
3. Relationship analysis: provides the scatter plot and box plot between multiple numerical columns
4. Time series analysis: provides statistics related to time/date column and provides graphs related to it.
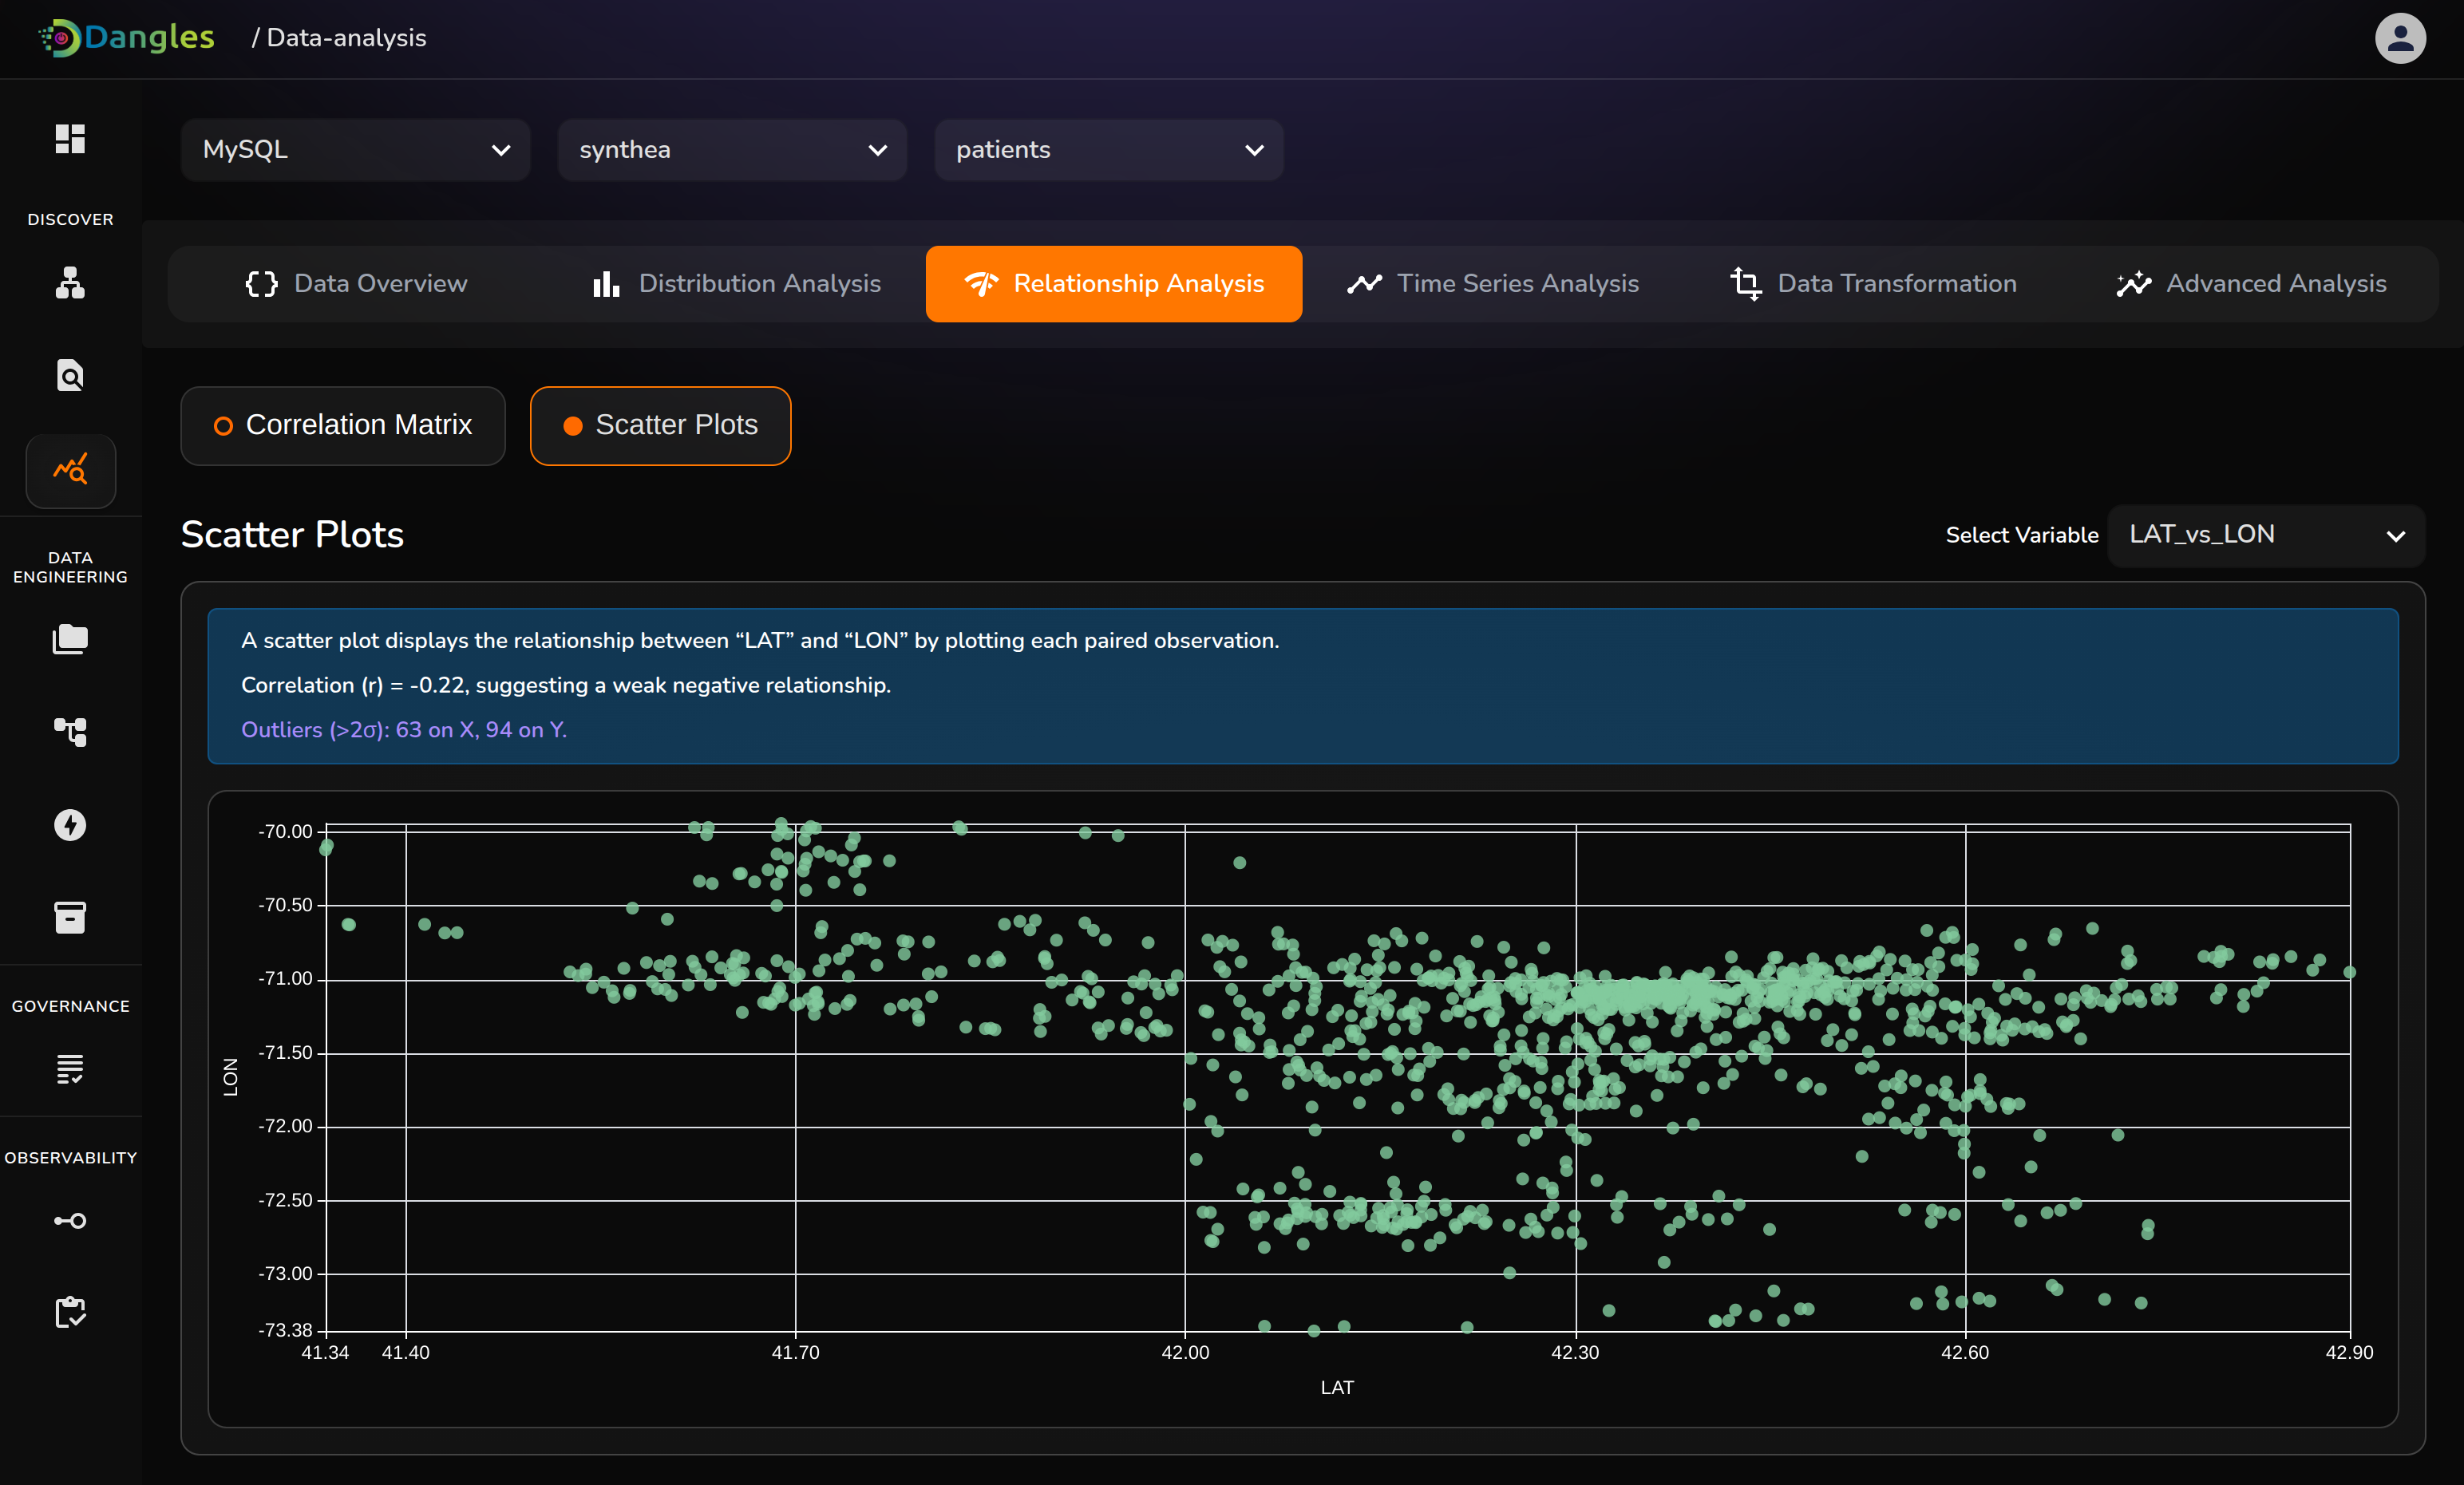
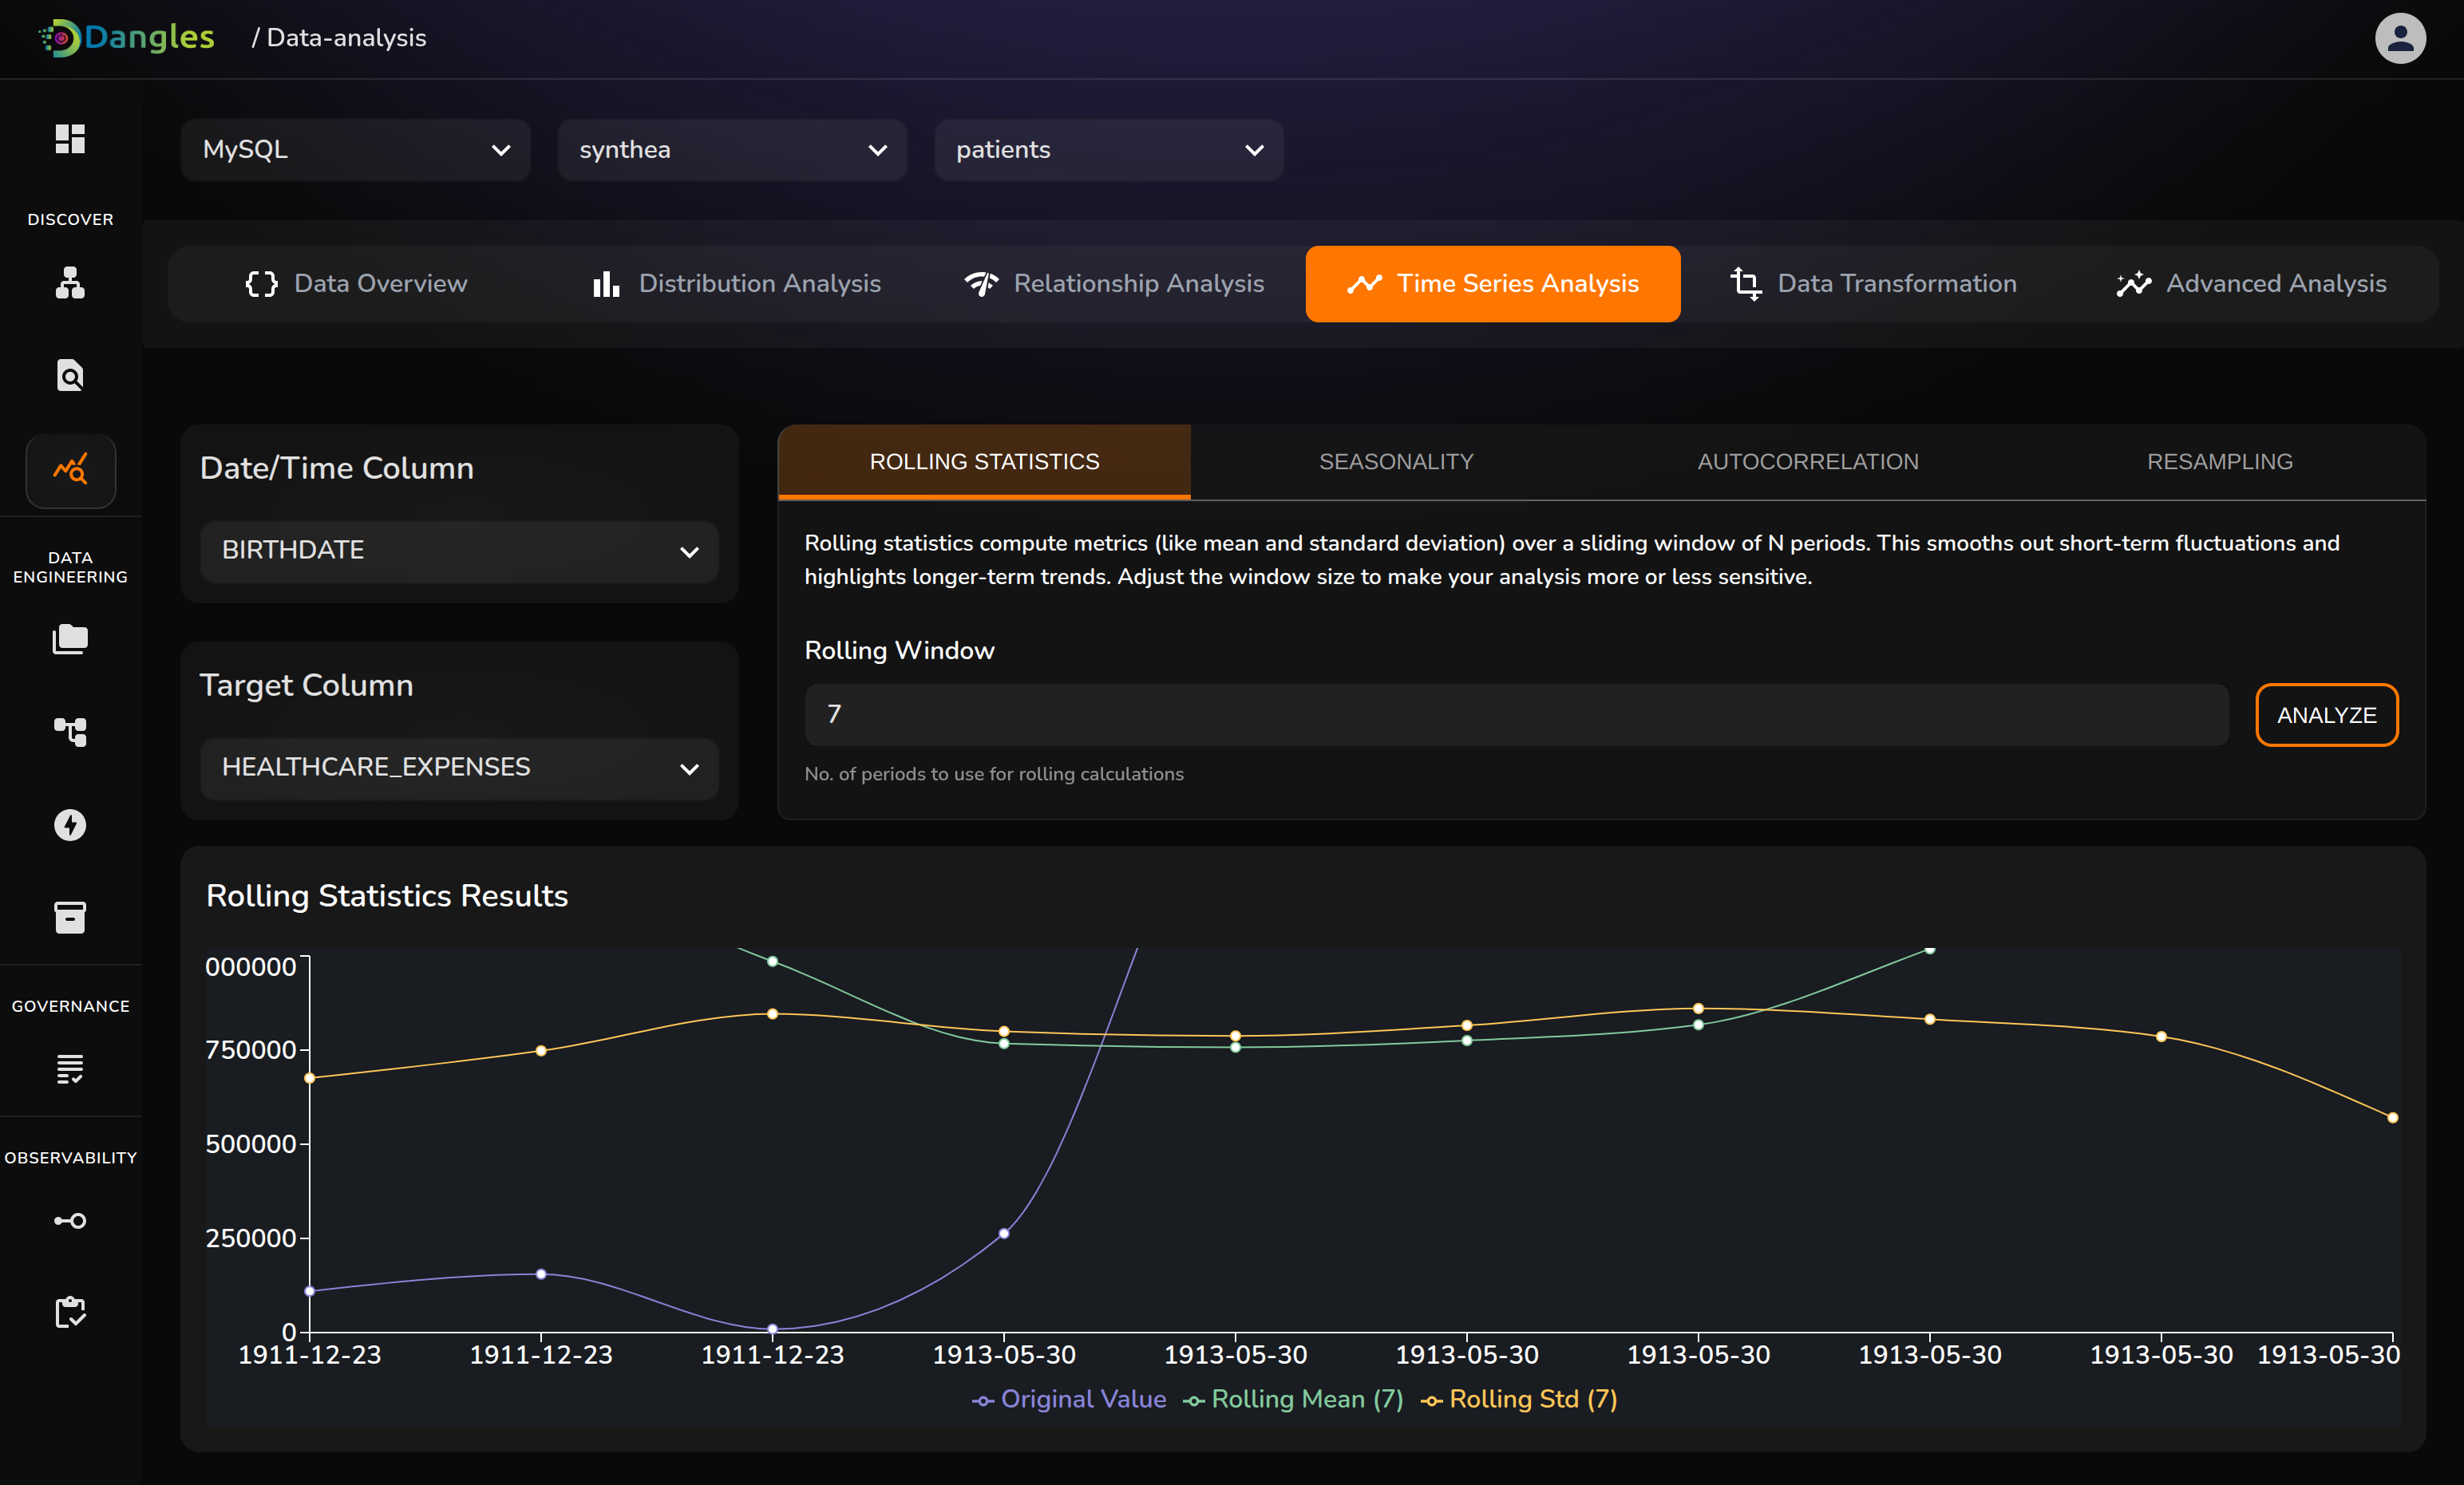
Relationship Analysis and Time Series Analysis
5. Data transformation & Feature Engineering : Binning, Normalization & standardization, one-hot encoding, Transformations
6. Advanced analysis: Provides the outliers, Principle Component Analysis, Clustering, and Feature Importance to a selected column/columns
Data Explore:
1. AI powered Metadata and Data Dictionary: AI powered metadata and data dictionary for complete understanding of database. Contextual description generation based on the metadata understanding.
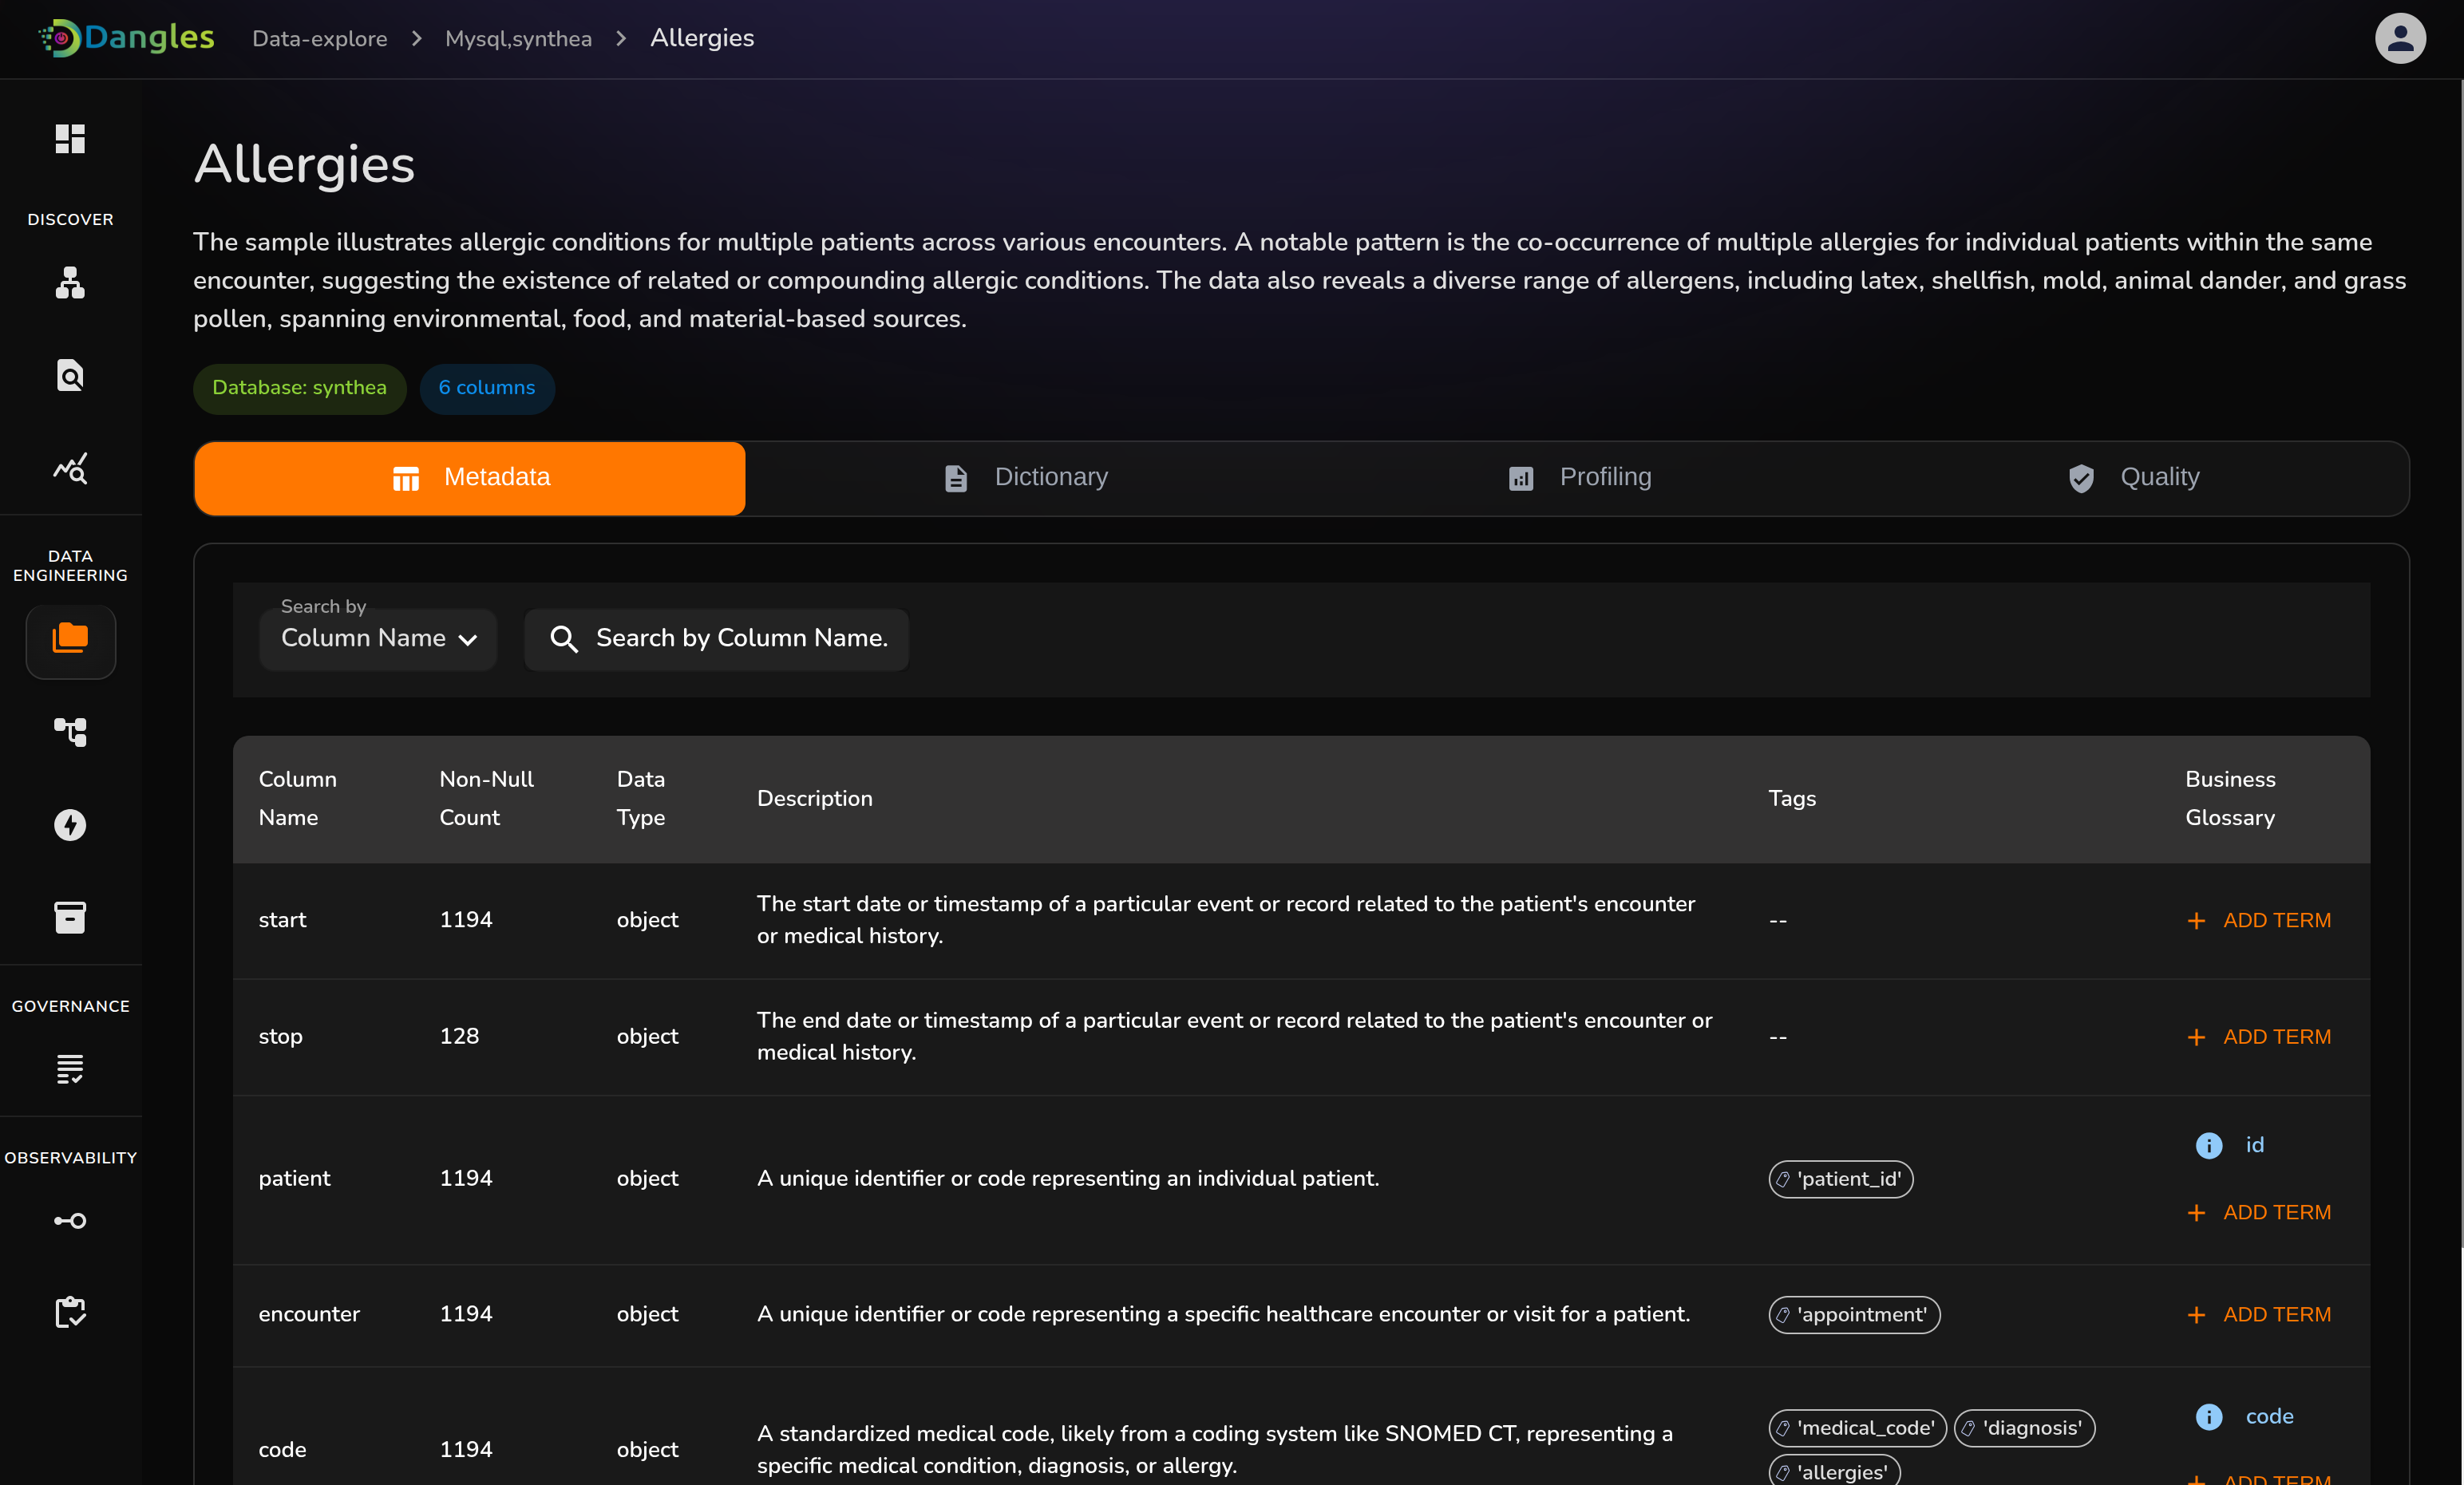
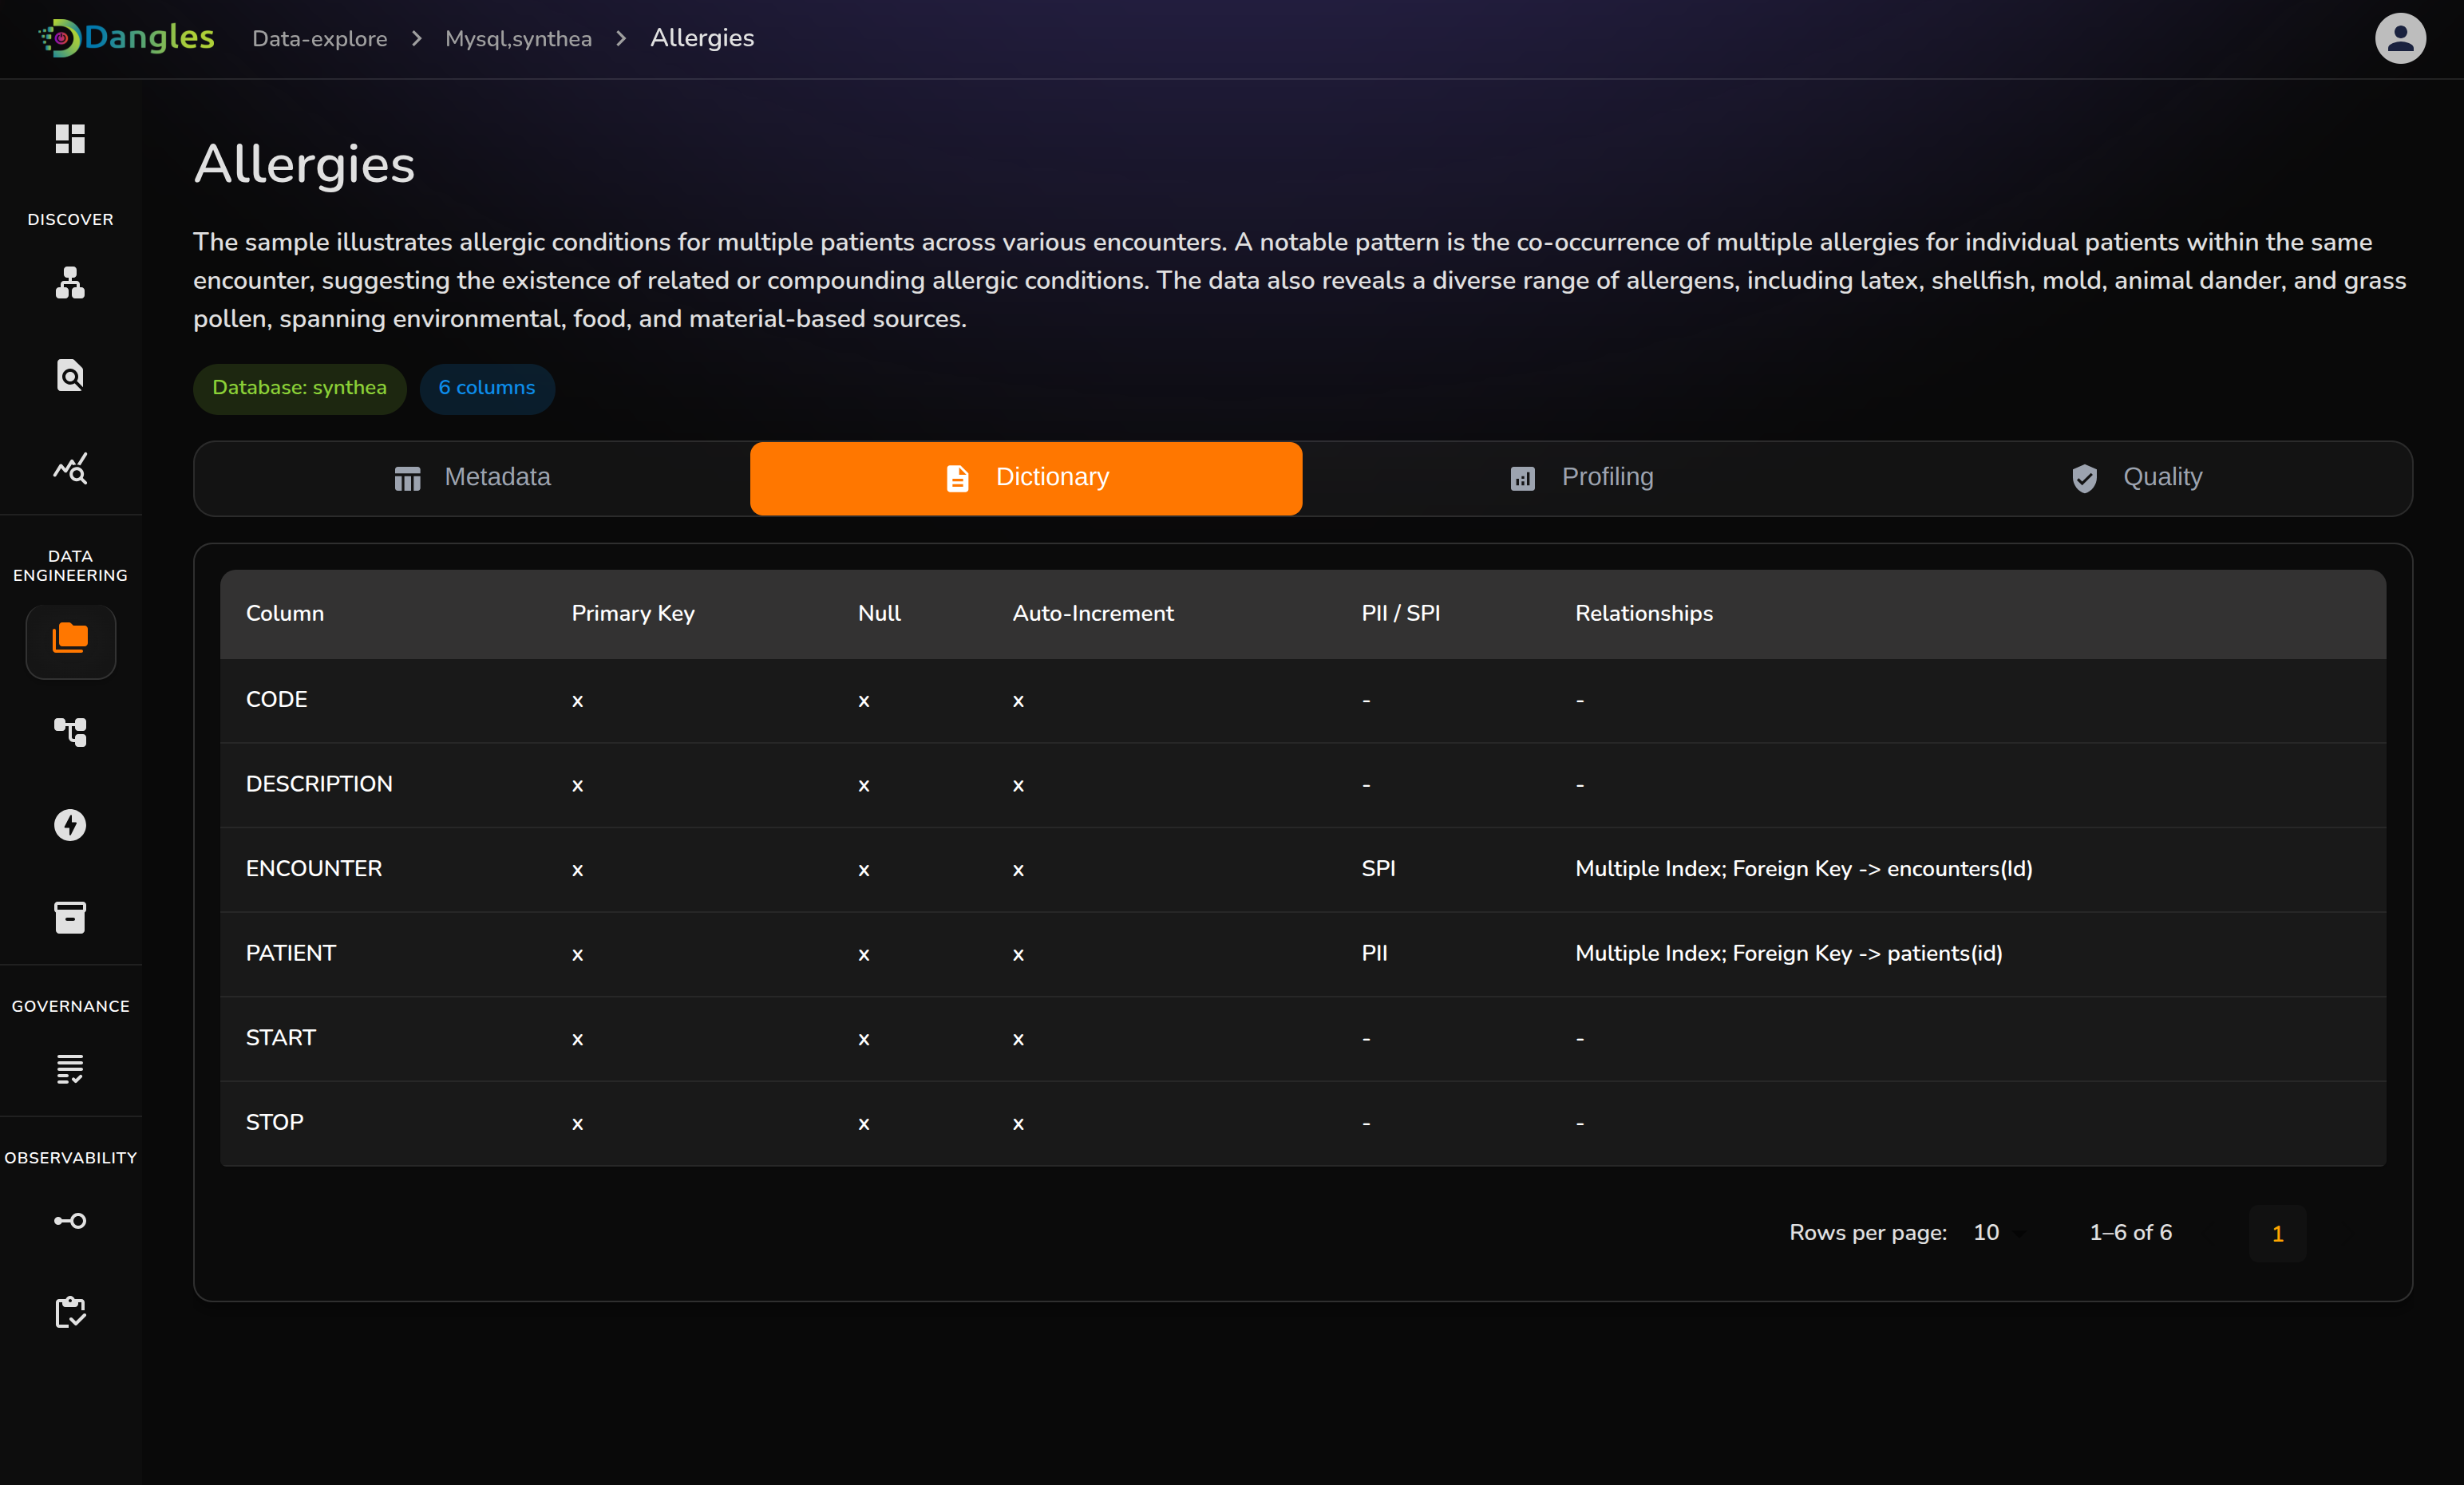
AI Powered Metadata and Data Dictionary
2. NEXEN AI Chatbot: Conversational Chatbot for data analysis related queries.Database level querying makes it possible for users to ask table agnostic questions.
3. Data Quality: we can add the test cases under a specific type of test where we already provided most used 30 types of tests, and these tests can be performed on the specific column.
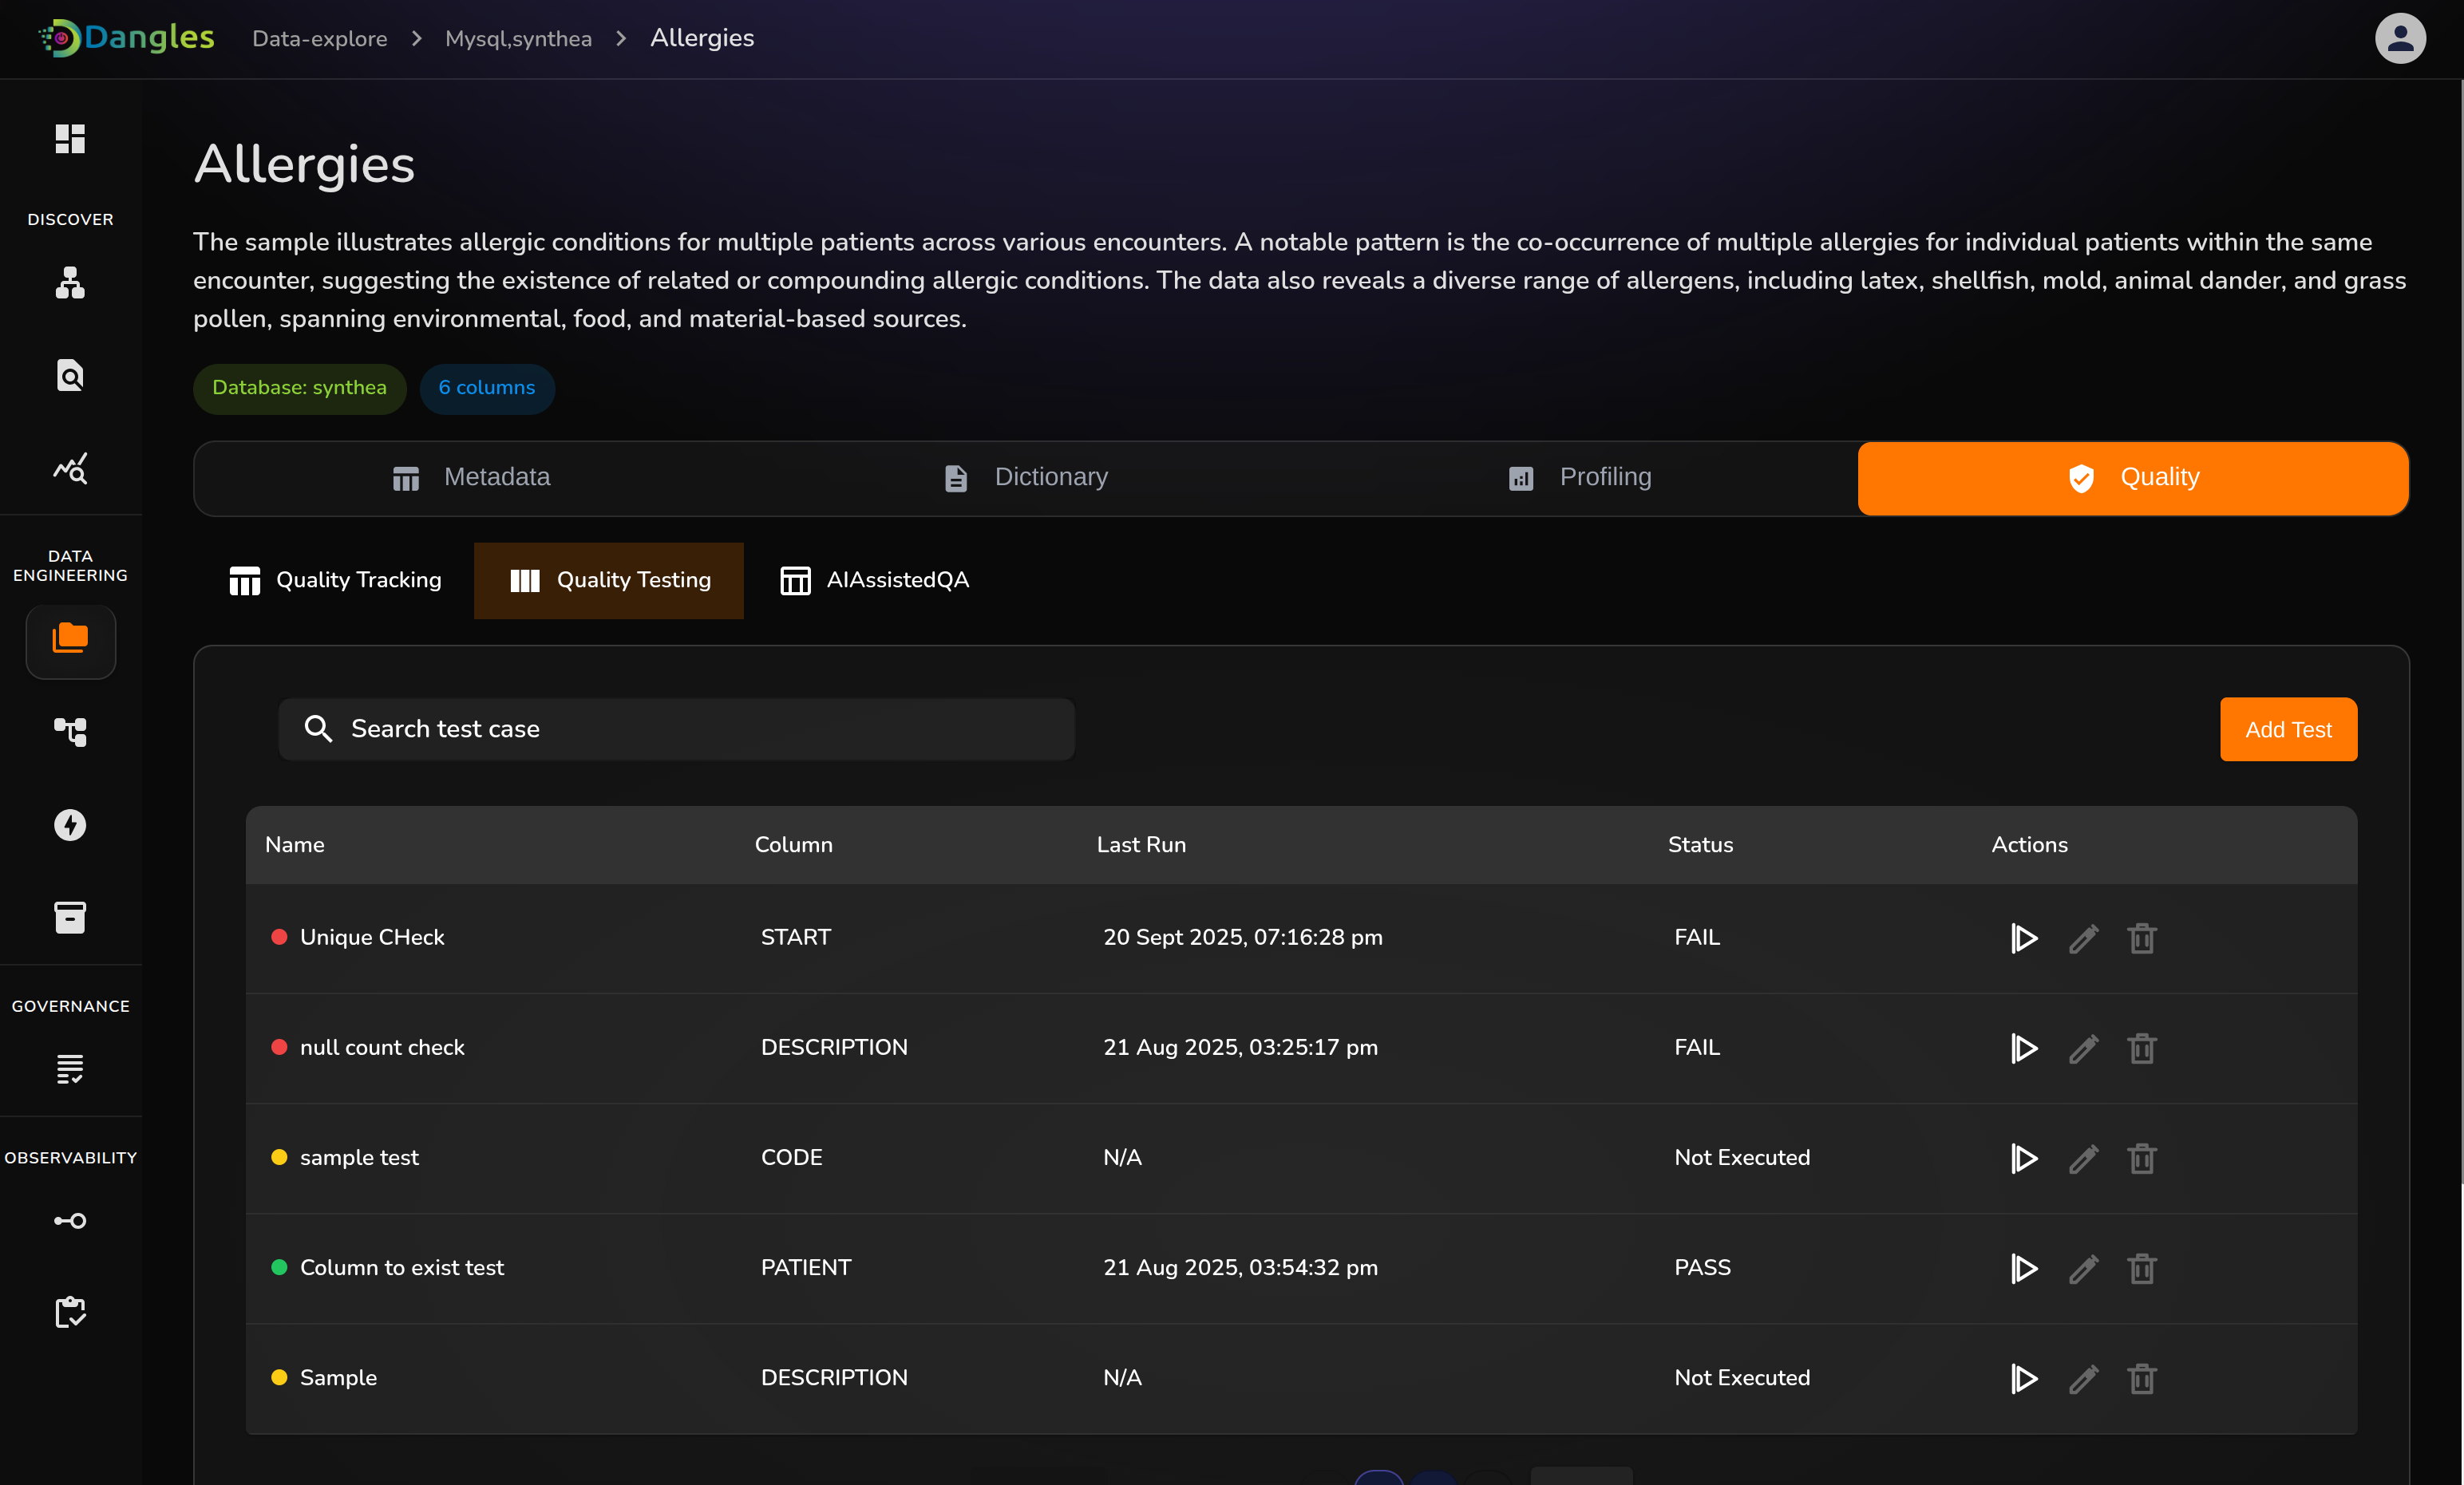
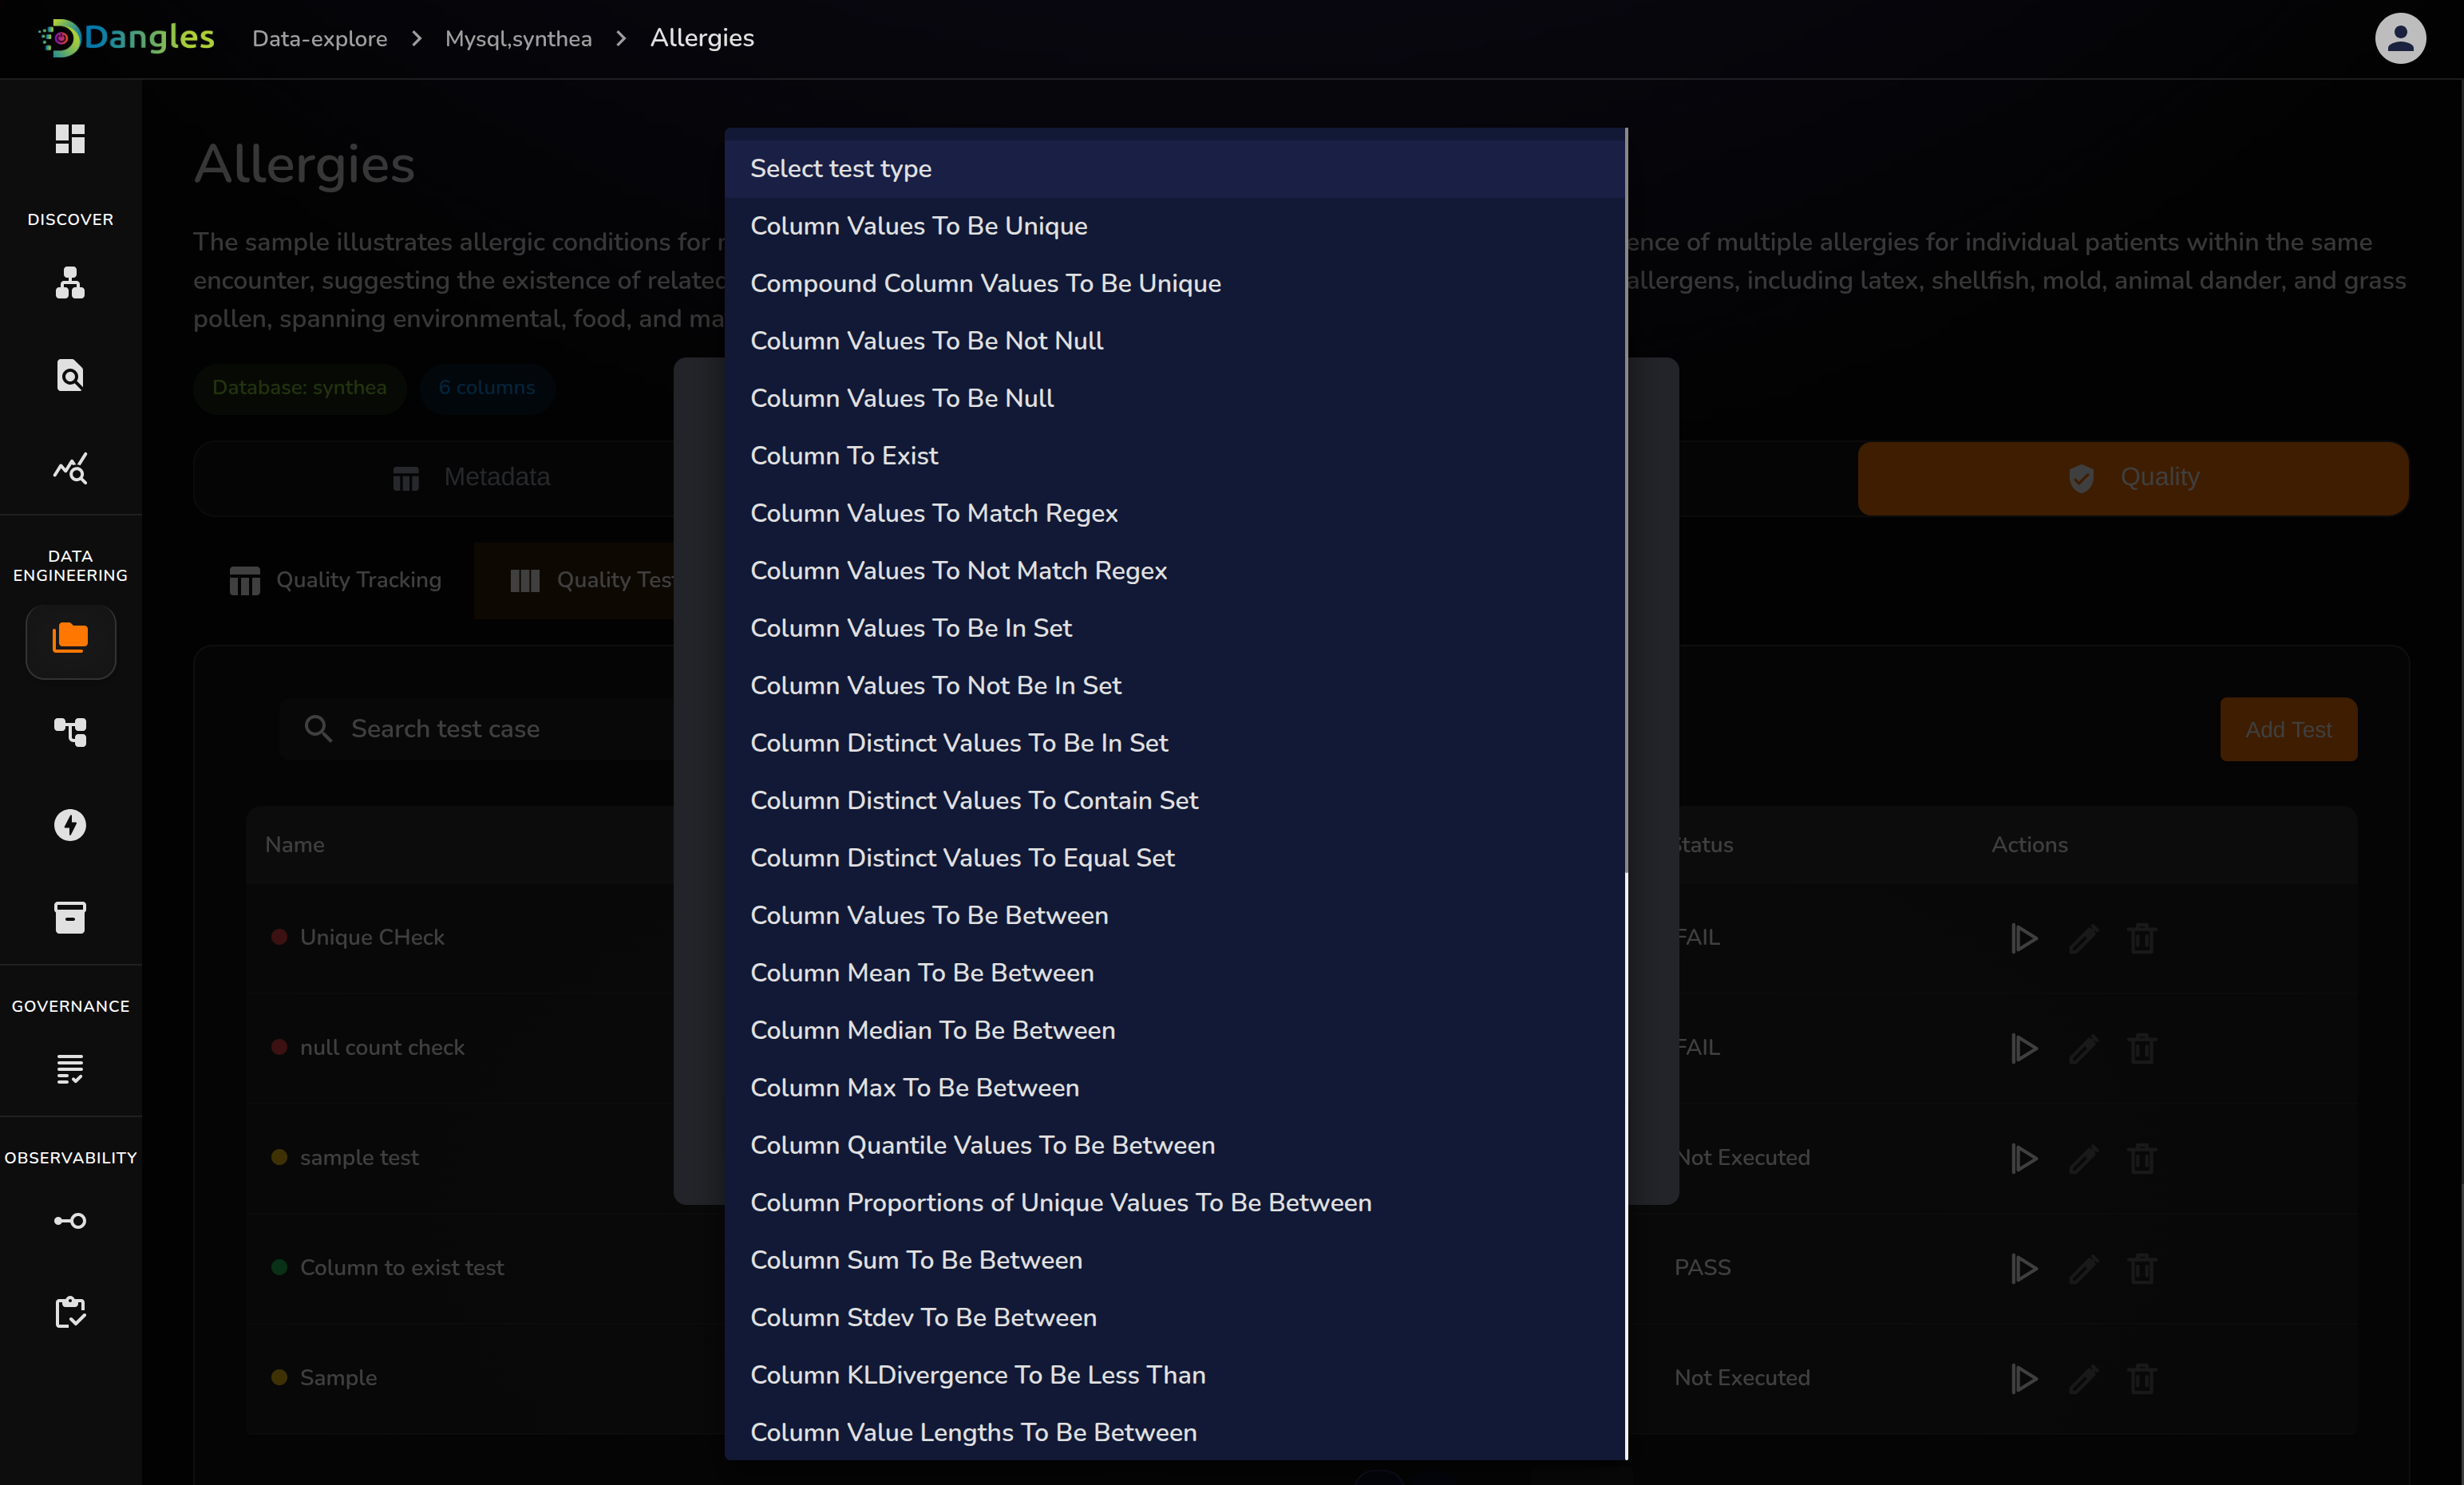
Data Quality:30+ Test Cases
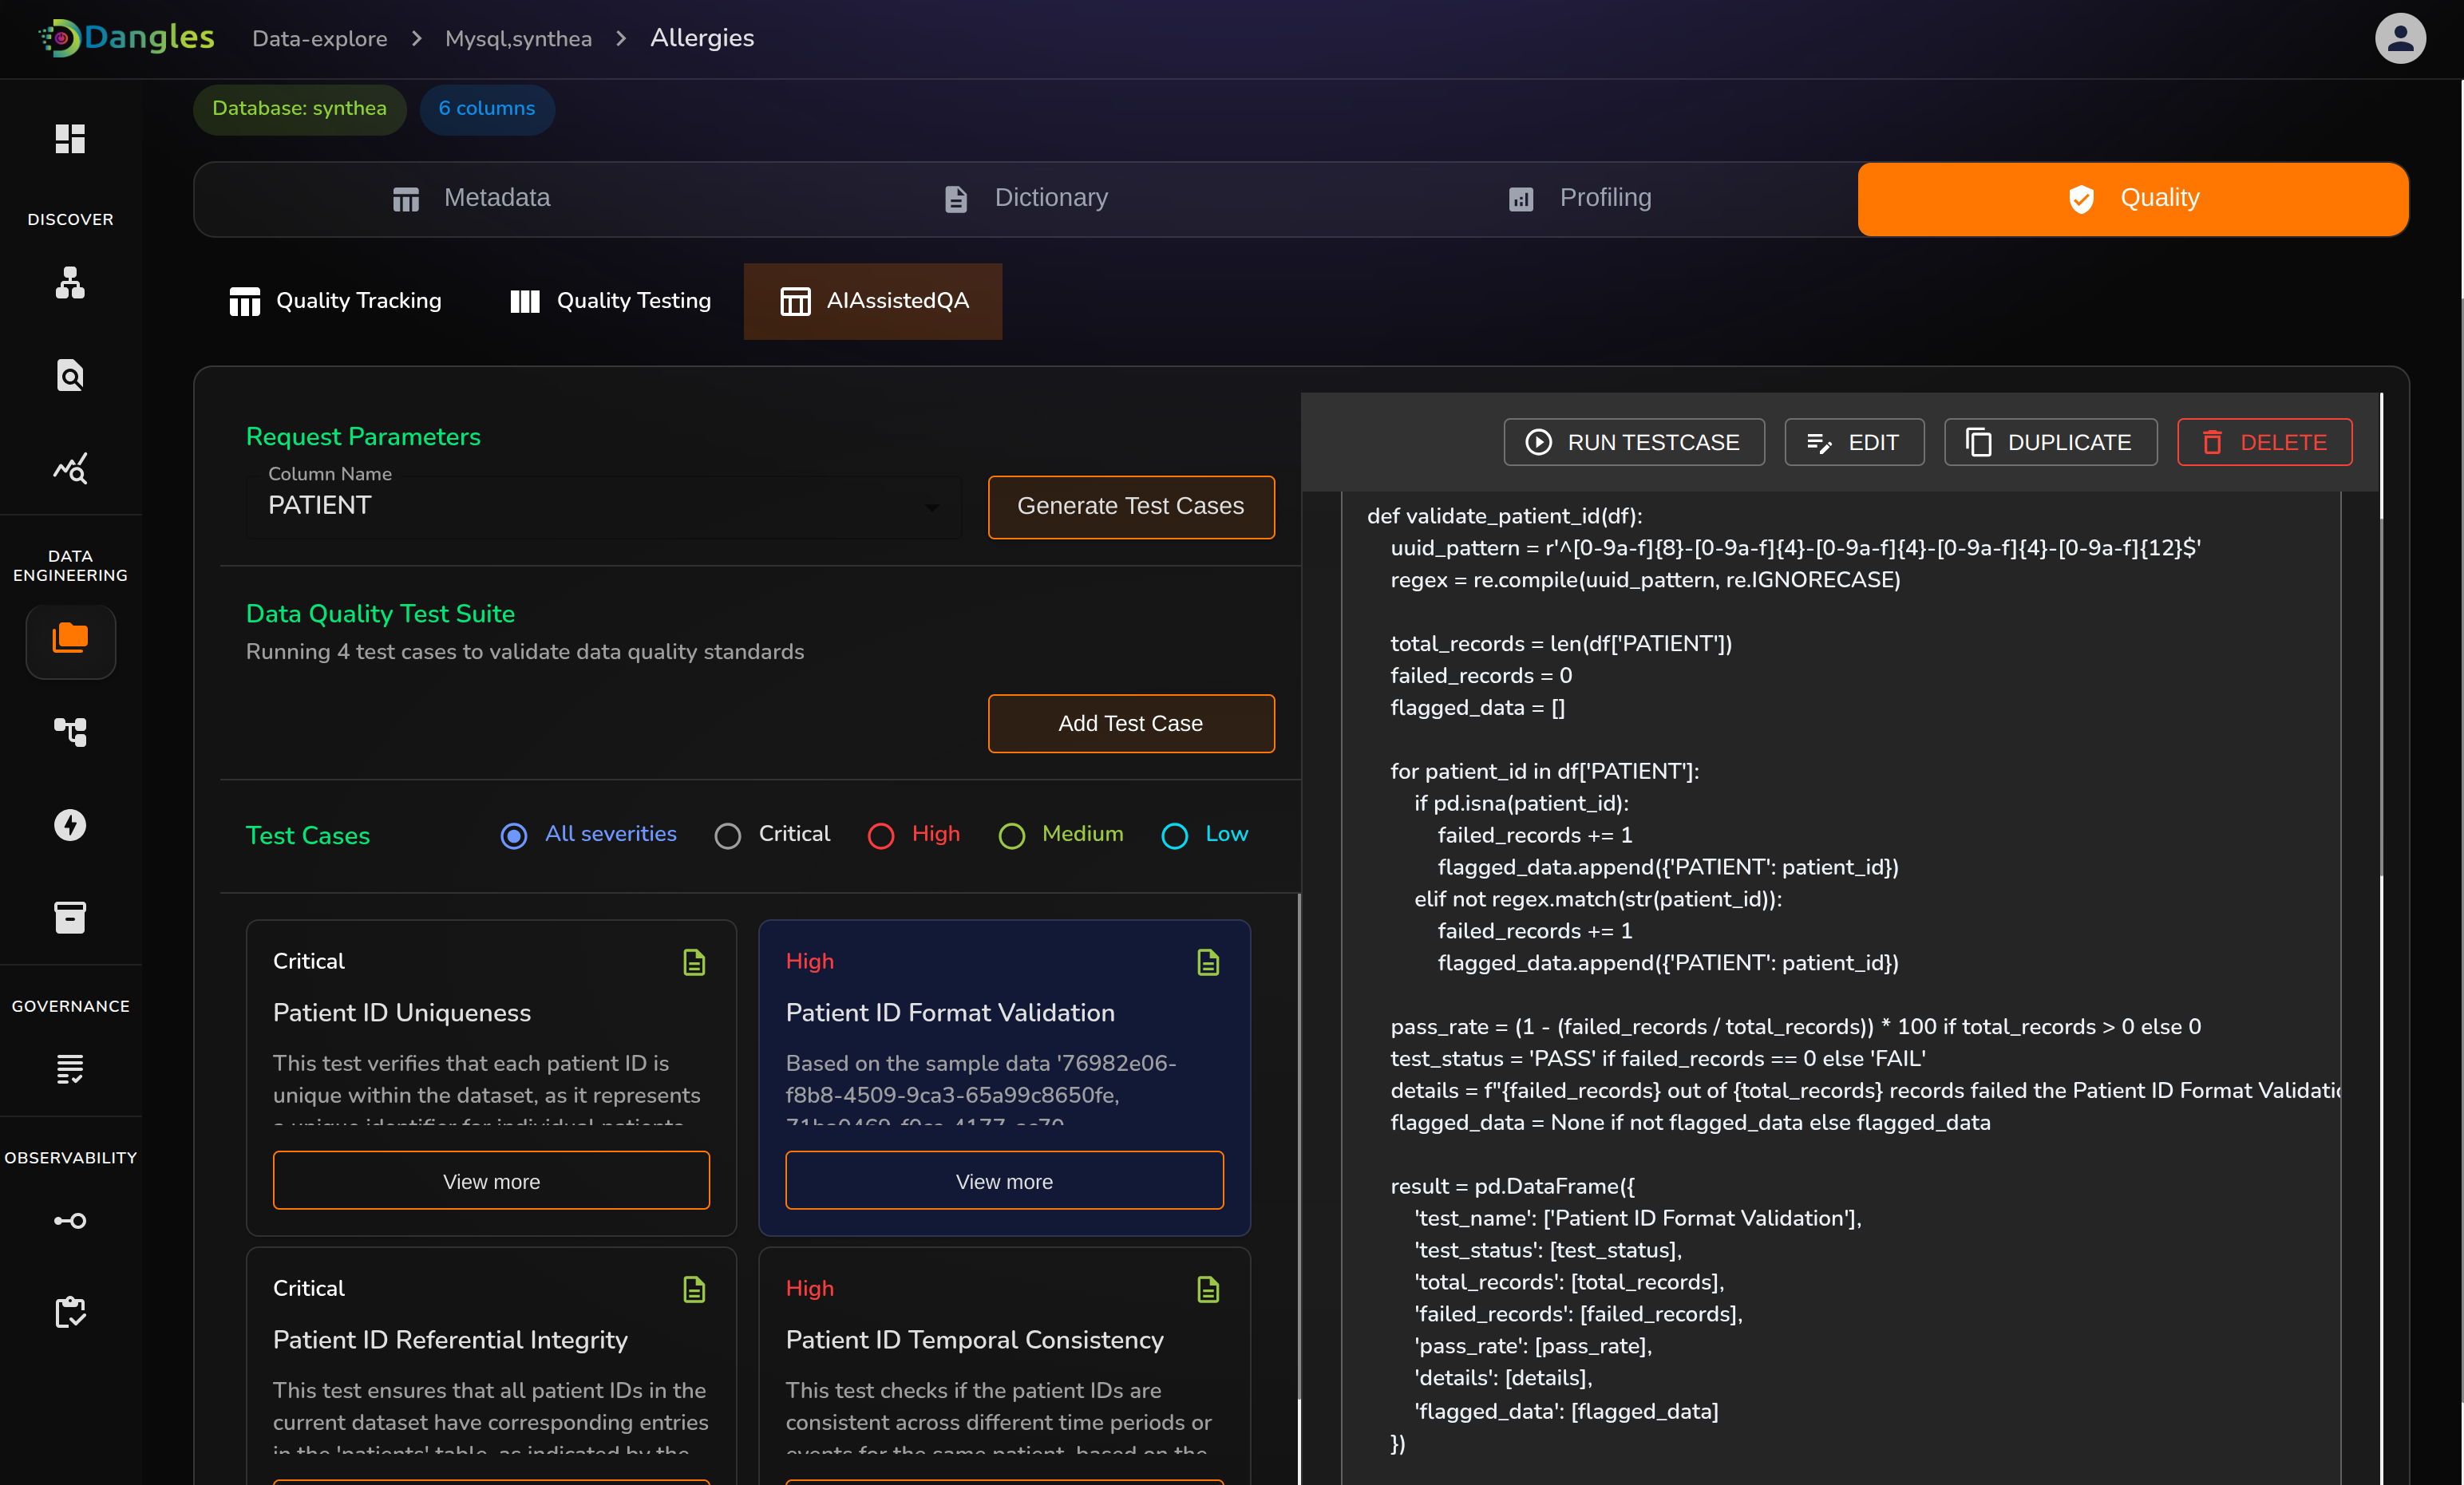
4. AI Assisted QA Testing: By using the AI(Claude) the test cases are created and formed as cards with the severity level(Critical, High, Medium and low) and can also change or rewrite the test case details and run it to get the results. They can also create new test cases using natural language.
Data Engineering Module:
1. ETL Tool: Data Teams can build pipelines use case in three ways : Standard Batch , Data integration and Streaming pipelines.
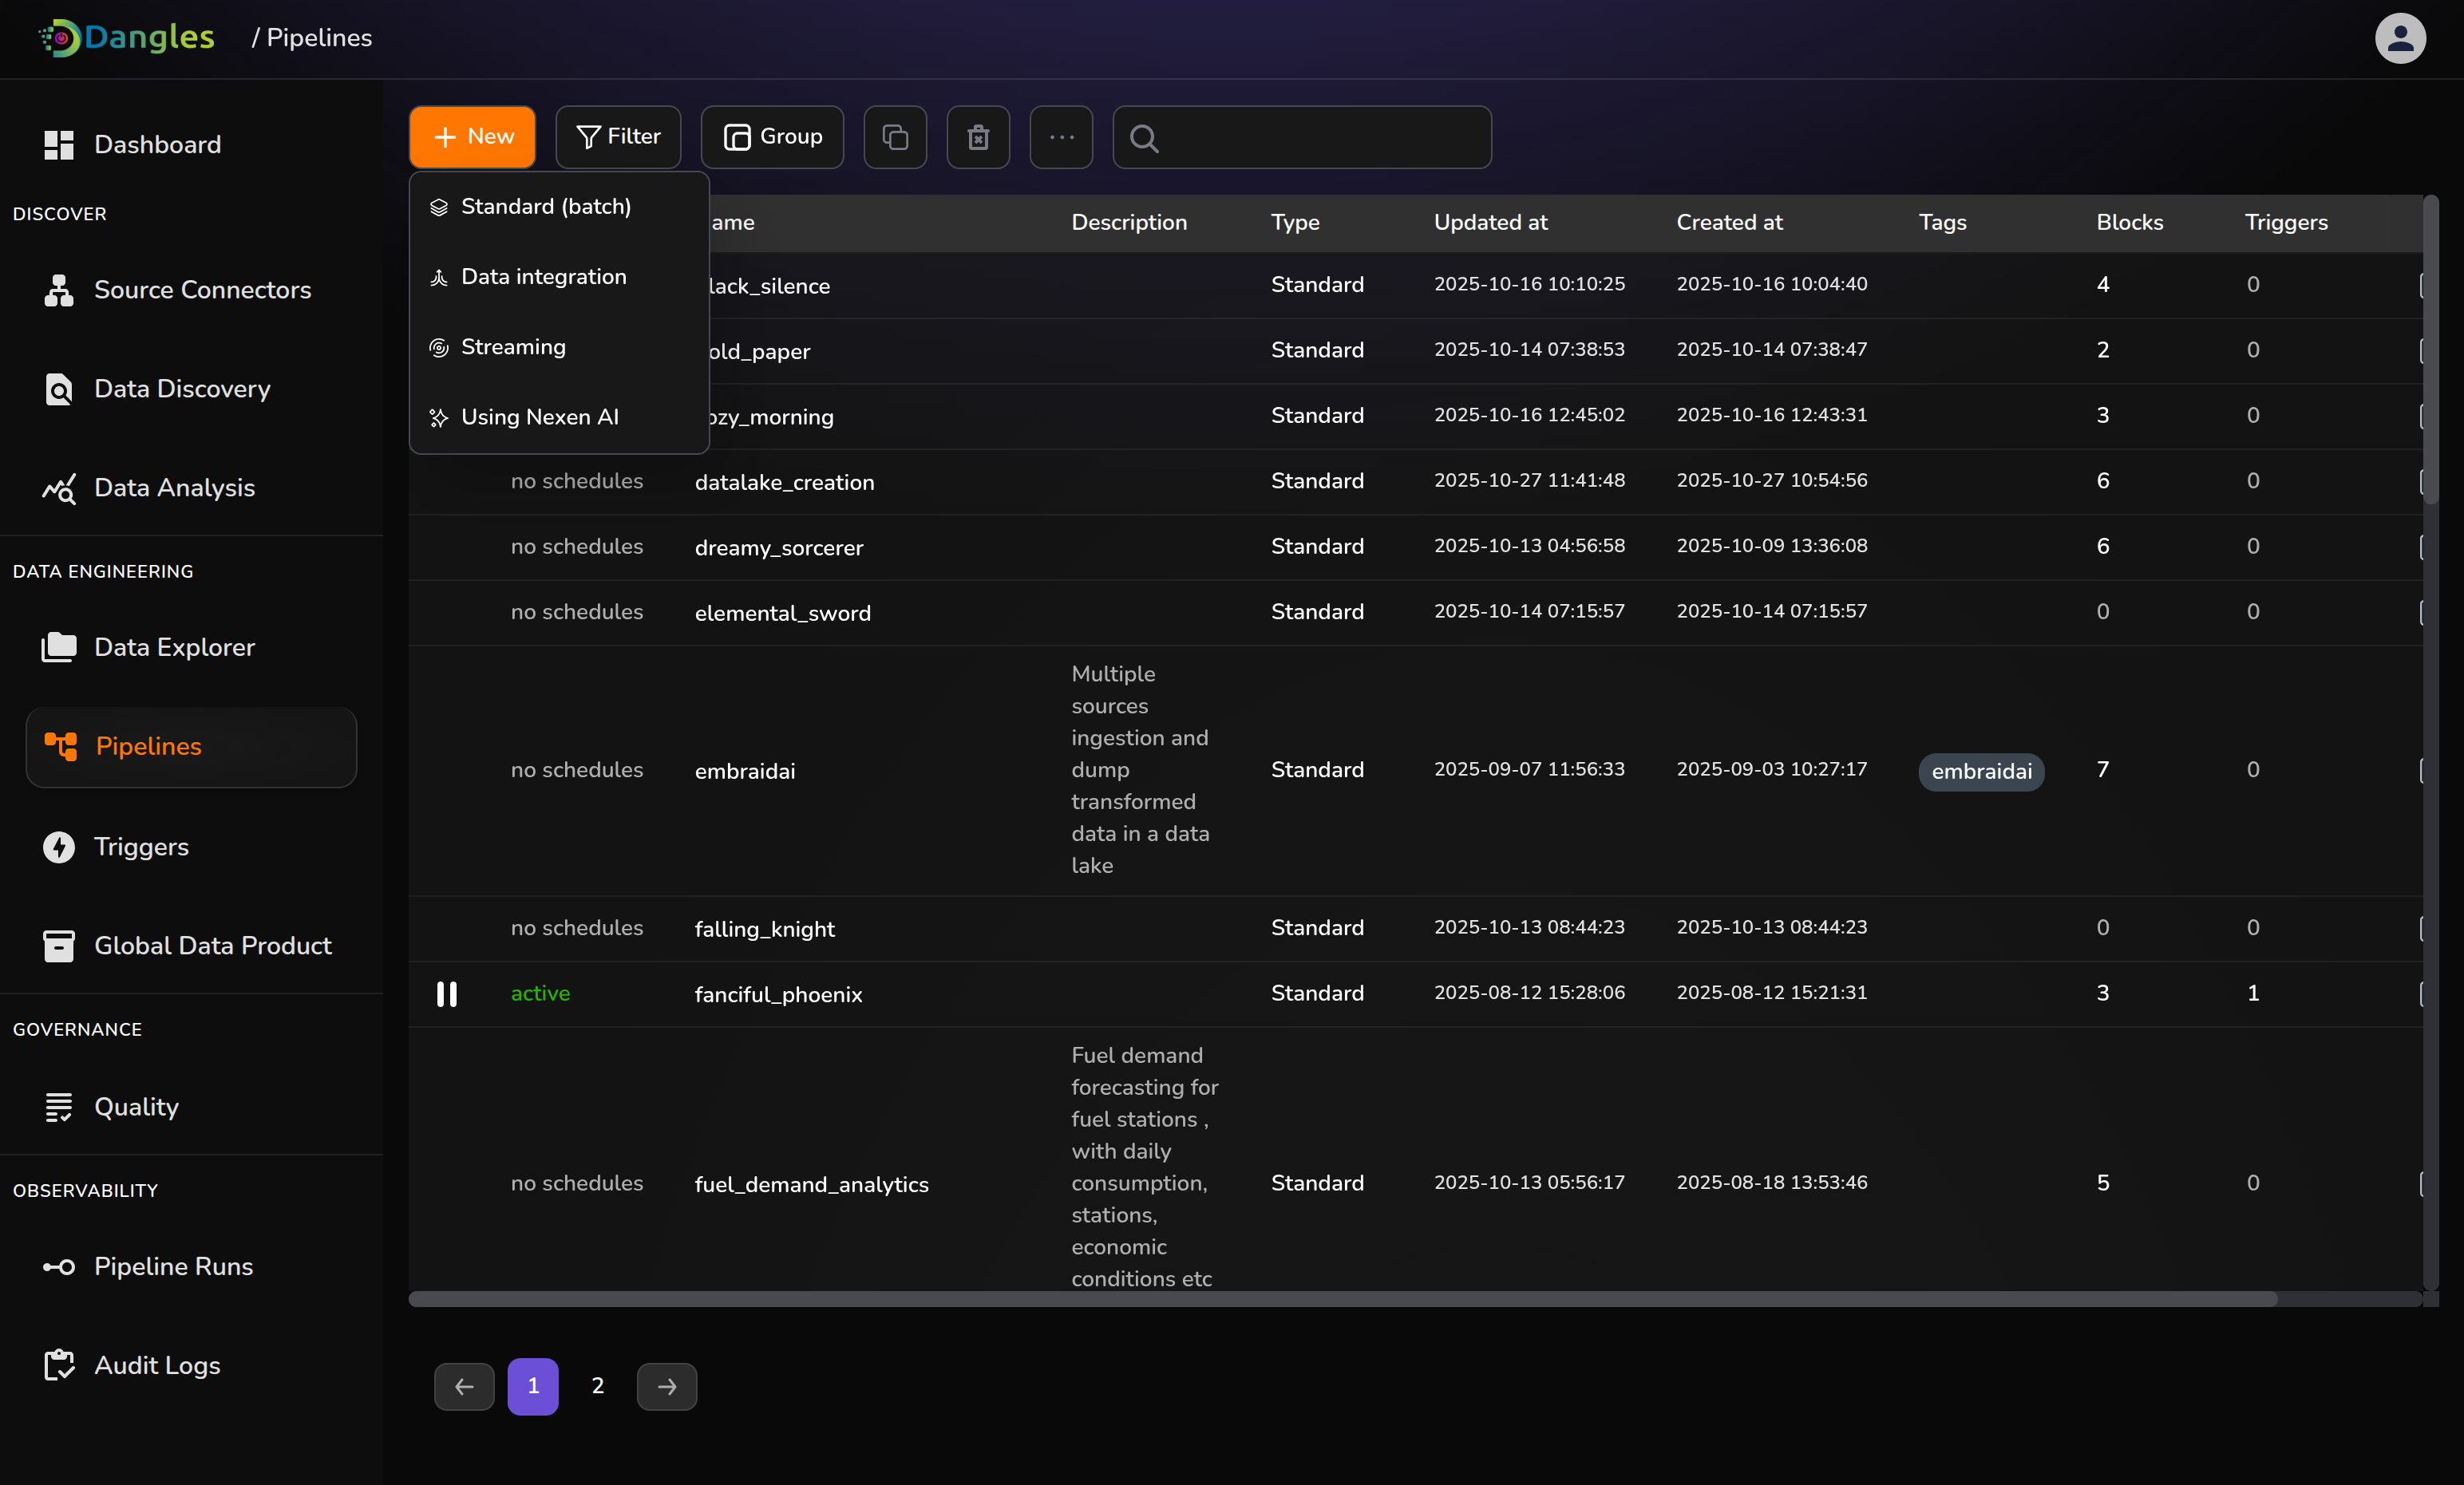
Pipelines Overview
2. Triggers: Once pipelines build is done by data teams ,they can trigger the pipelines in 3 ways: Schedule(timeline basis), Event(Triggered by a conditional events in the platform), API(triggered with API call from any external source).
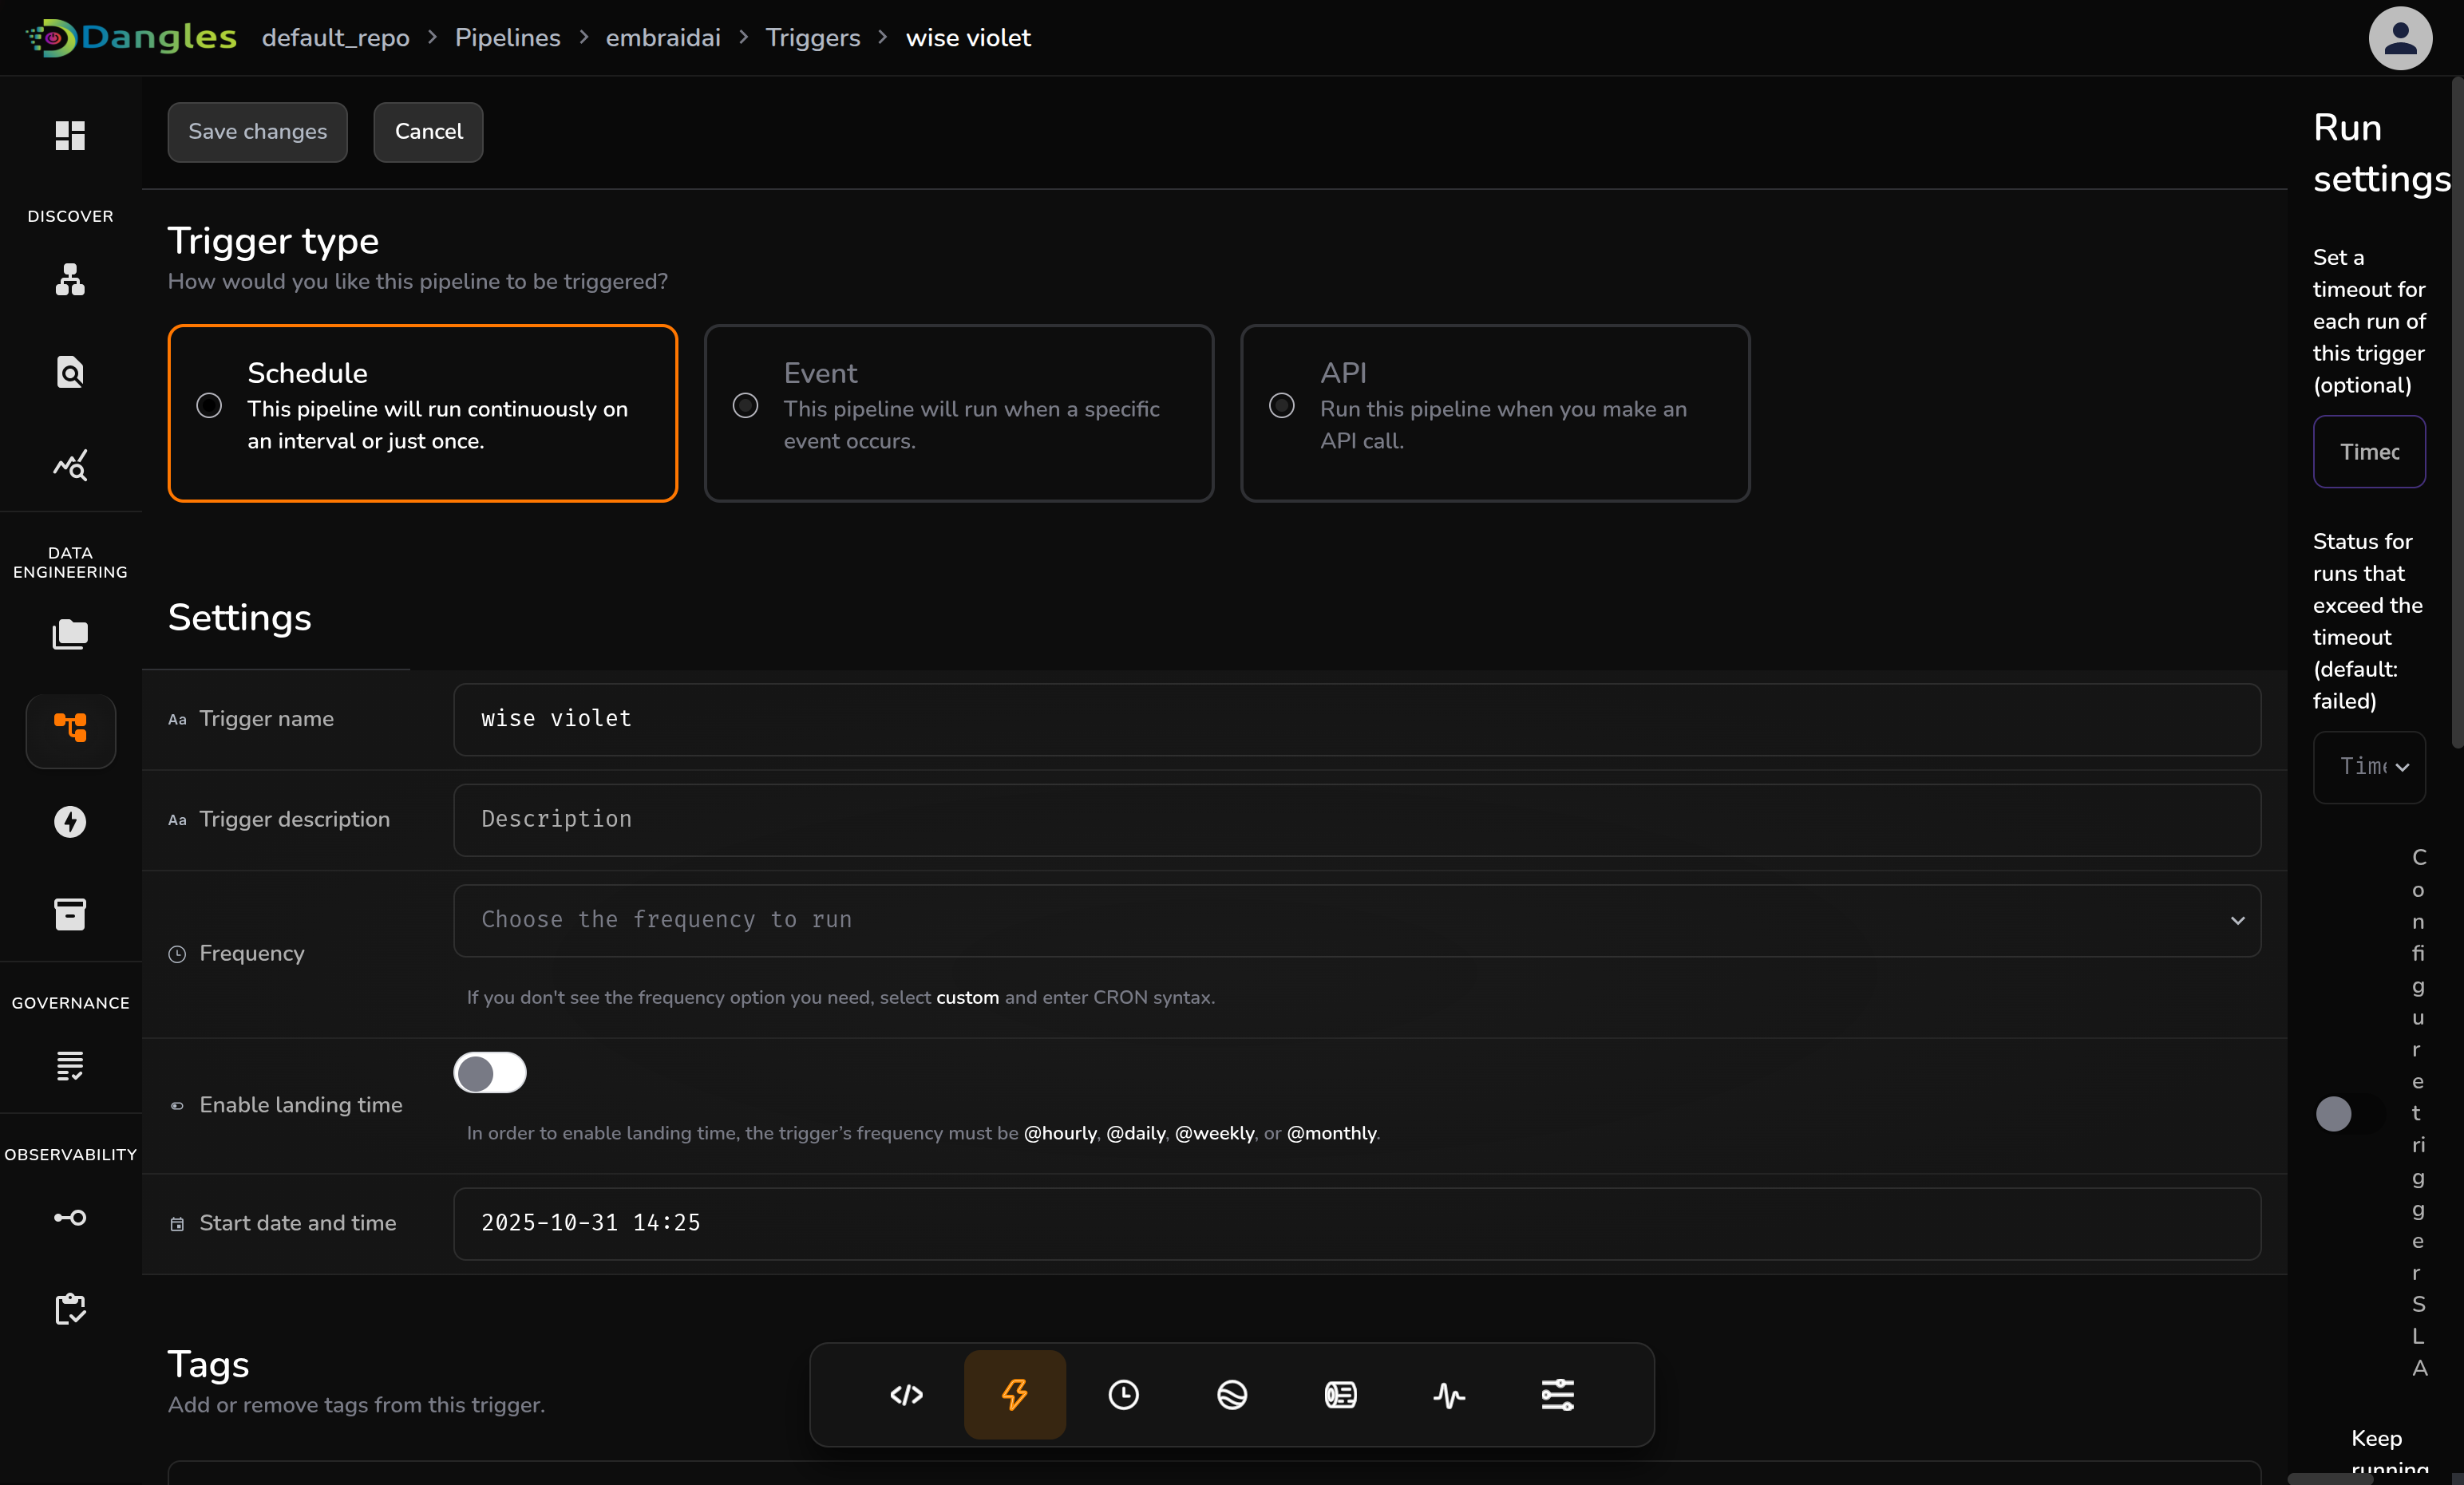
Triggers: Schedule , Event driven and API
3. Global Data products: Any computationally expensive or time taking operation output can be stored as global data product and further can be used in other pipelines to save time and computer power.
4. Inbuilt-Visualization features are made available for users to create charts like bar chart, pie chart , histogram etc. based on their requirements without writing a single line of code, made completely customizable for users.
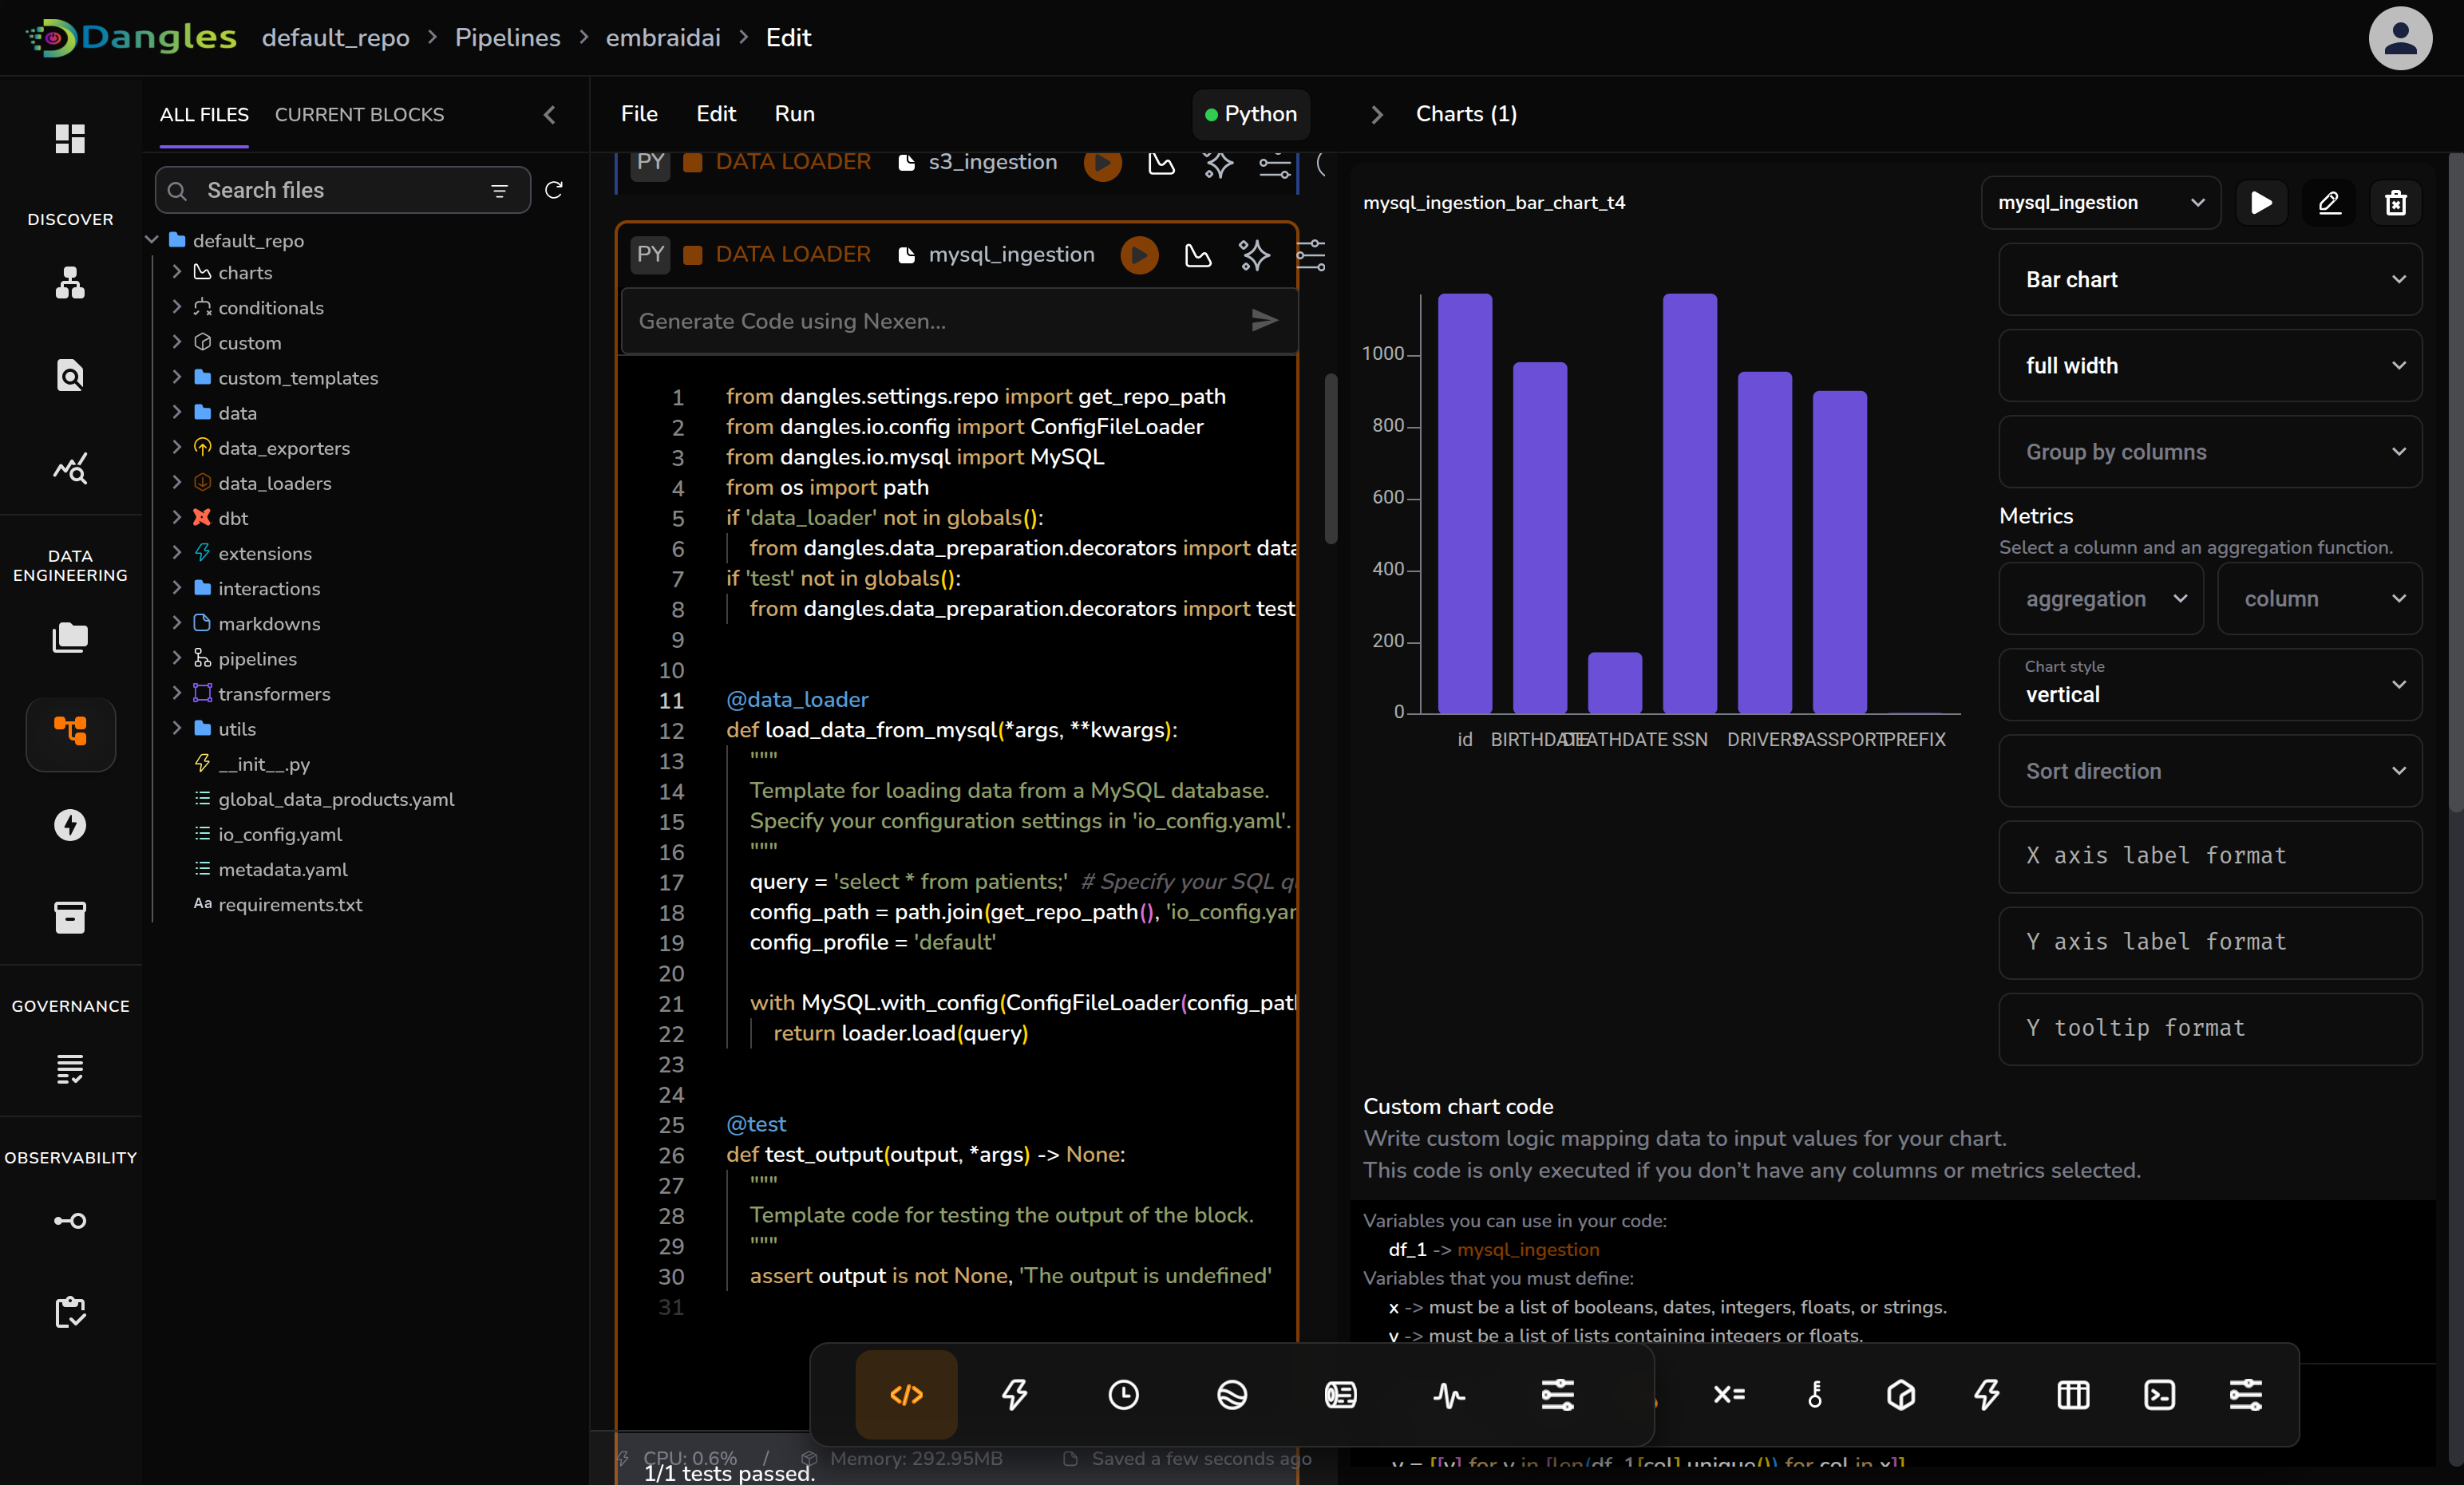
Inbuilt Visualization
Governance Module:
Quality Dashboard: A comprehensive dashboard for quality checks that are
being done on the data sources. Test results can be filtered based on
the date range, trend analysis on failed and passed test analysis. All the test cases are divided in 6 categories: uniqueness, accuracy, validity, completness, integrity, consistency
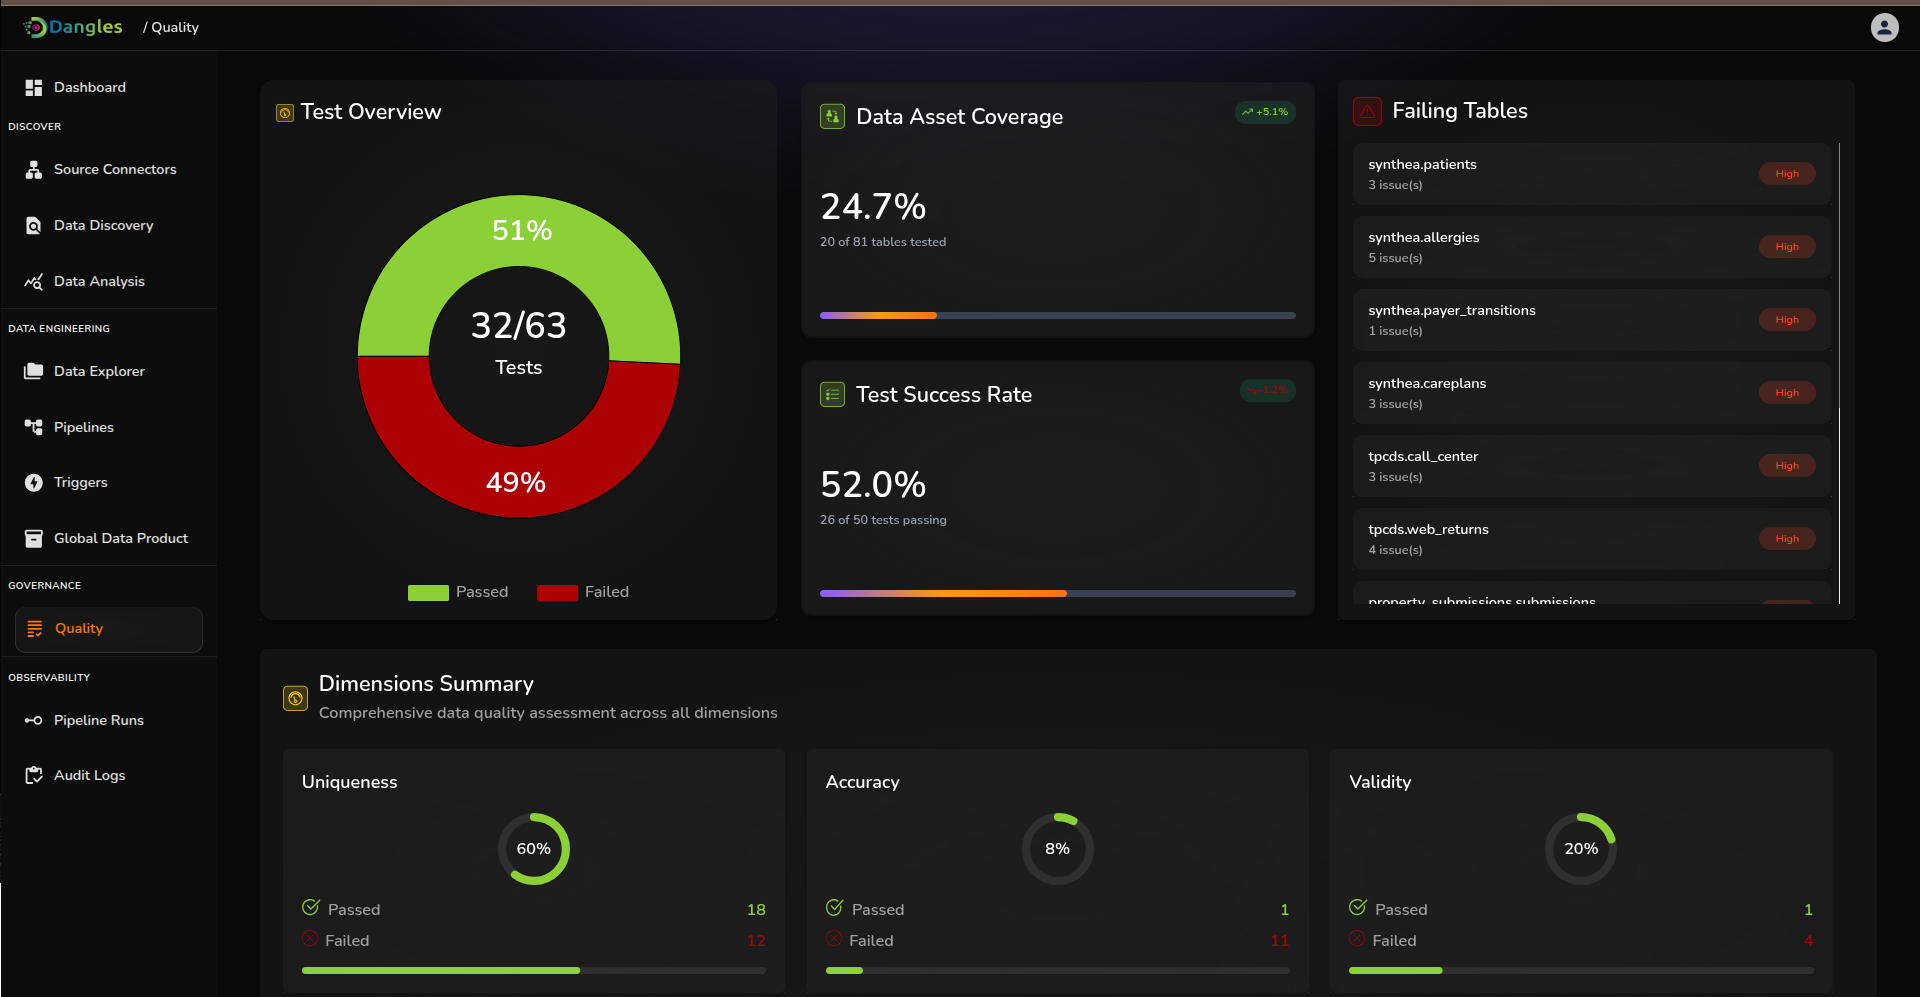
Governance
Observability Module:
This module offers the monitoring for the platform, both on operations level and user level.
1. Pipeline Monitoring: provides the pipelines live status, logs, timeline of pipeline executions fetched from the data engineering module.
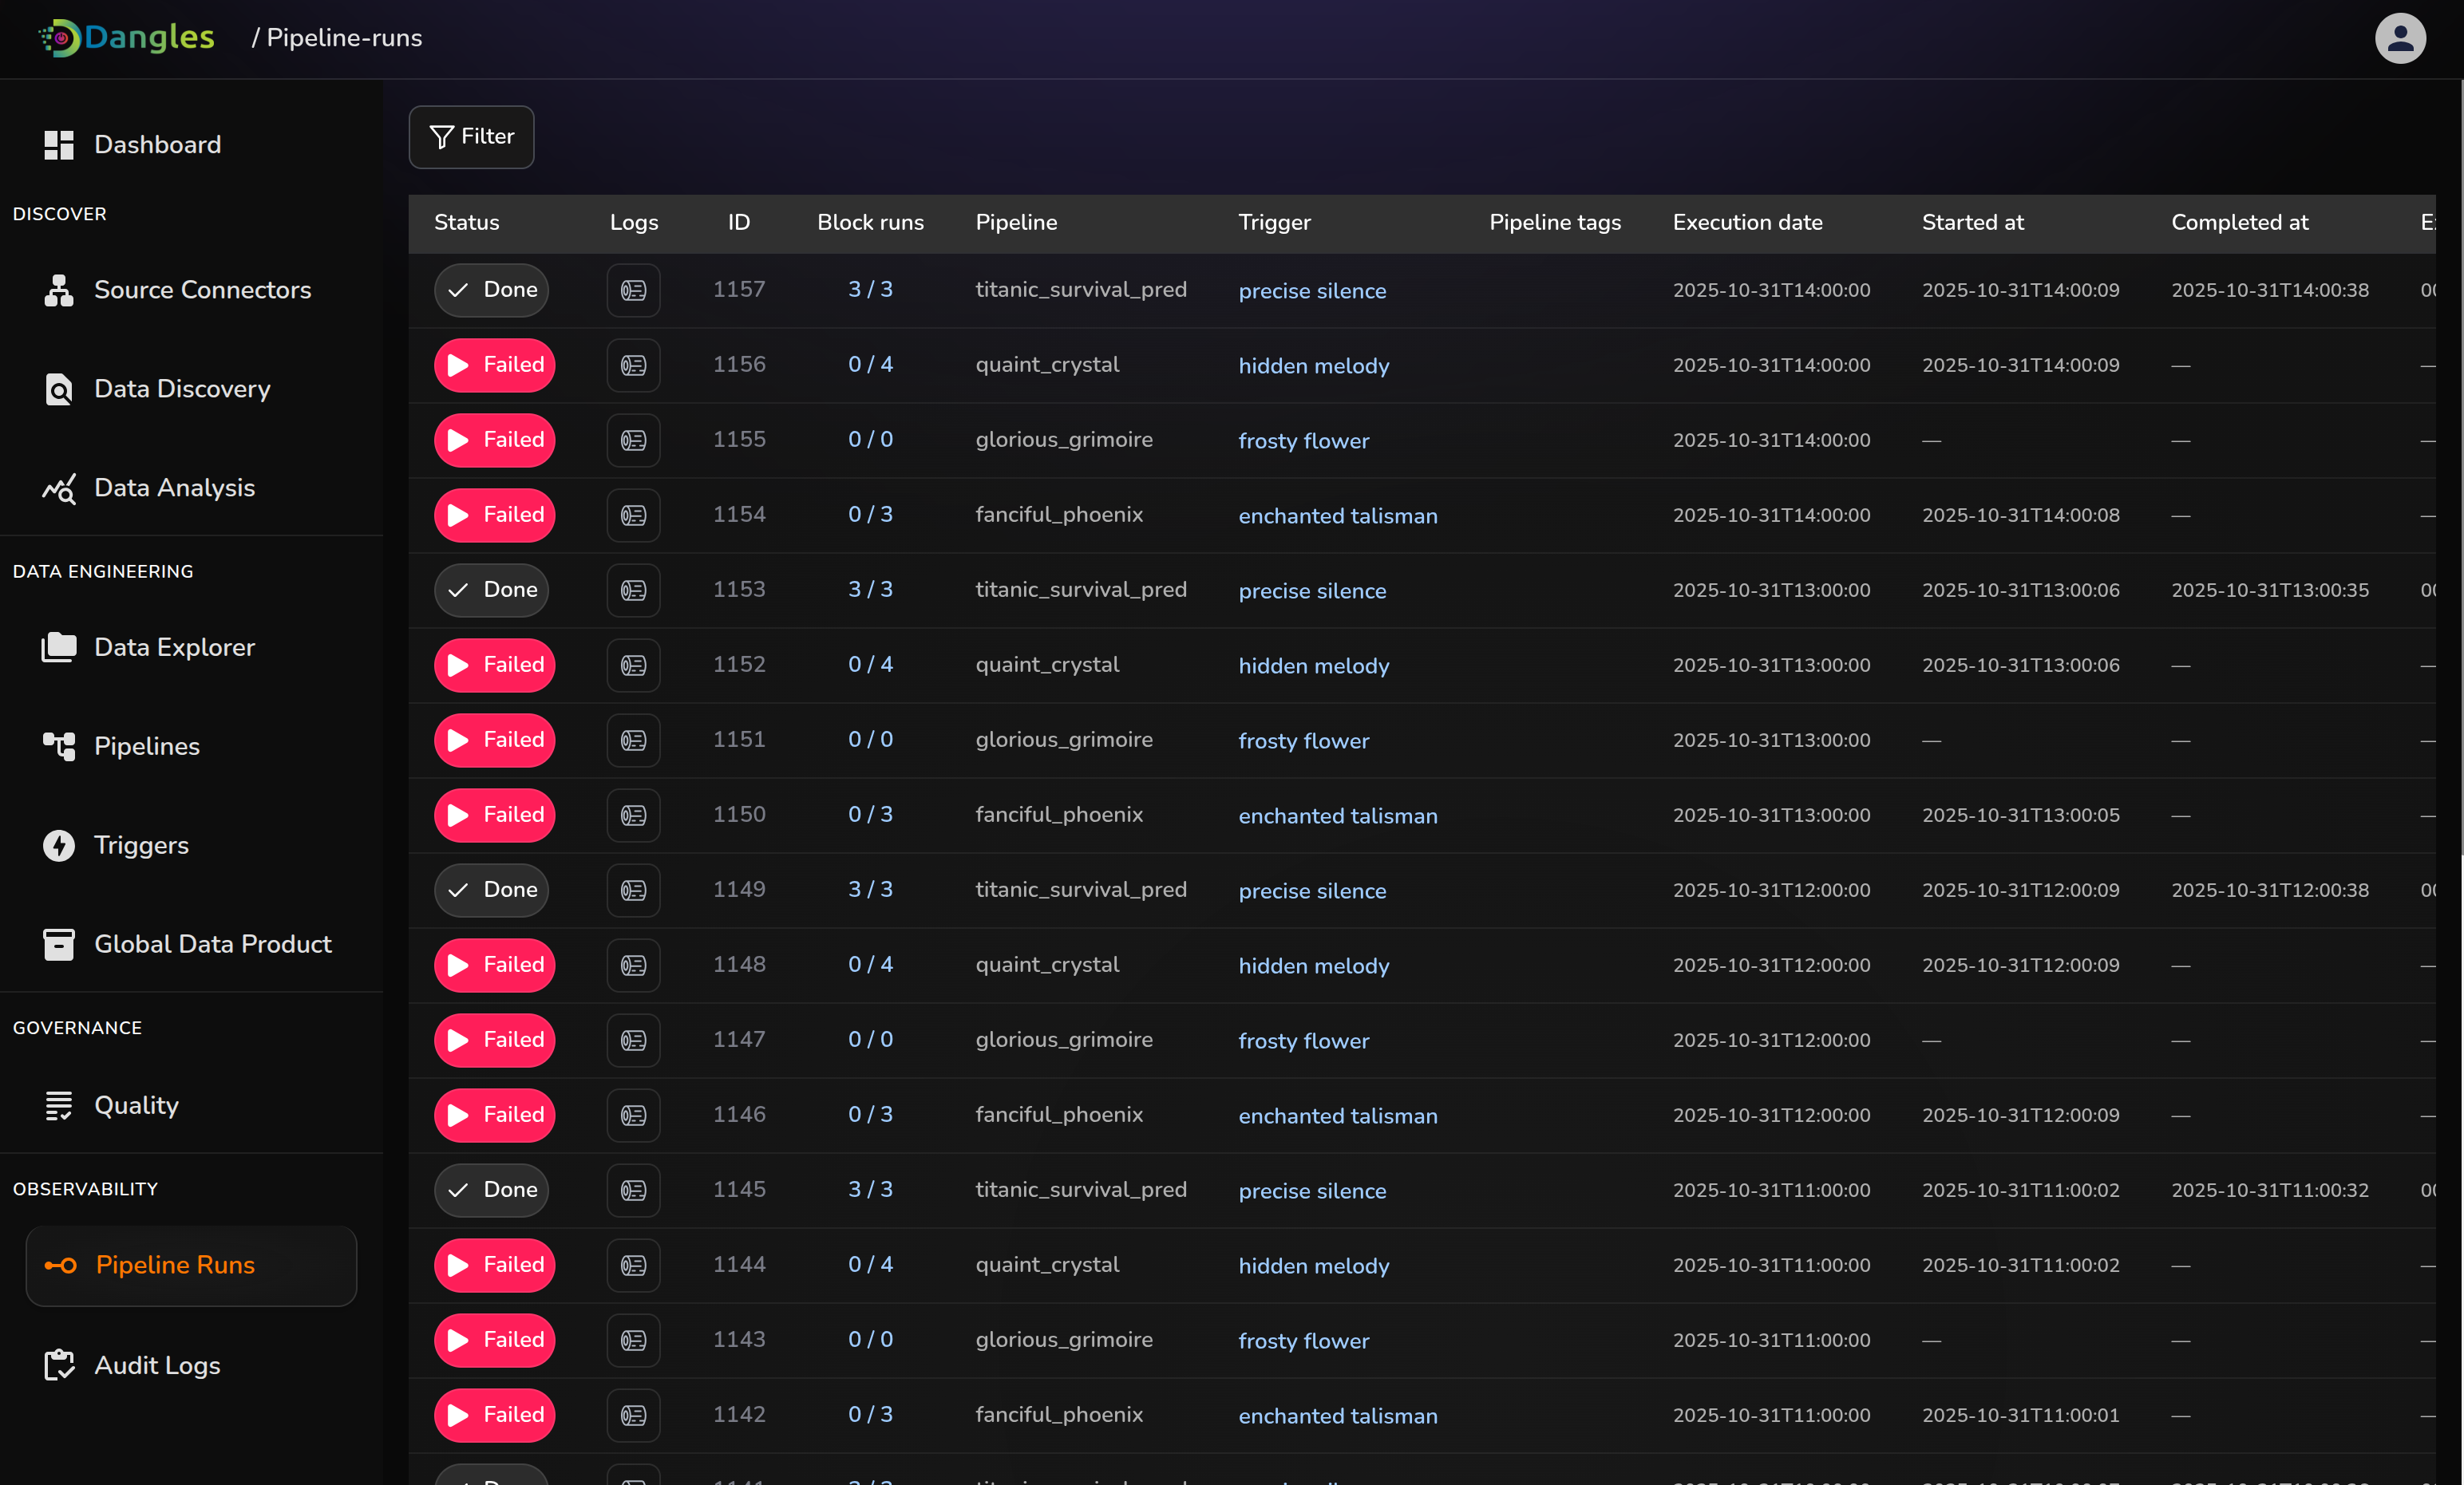
Pipeline Observability
2. Audit Logs: provides user activity for admin, operations that are
done on platform , with technical specs of features. Requests that got
failed and passed to provide transparency within the org and give admin
control over operations and better clarity on members activities.
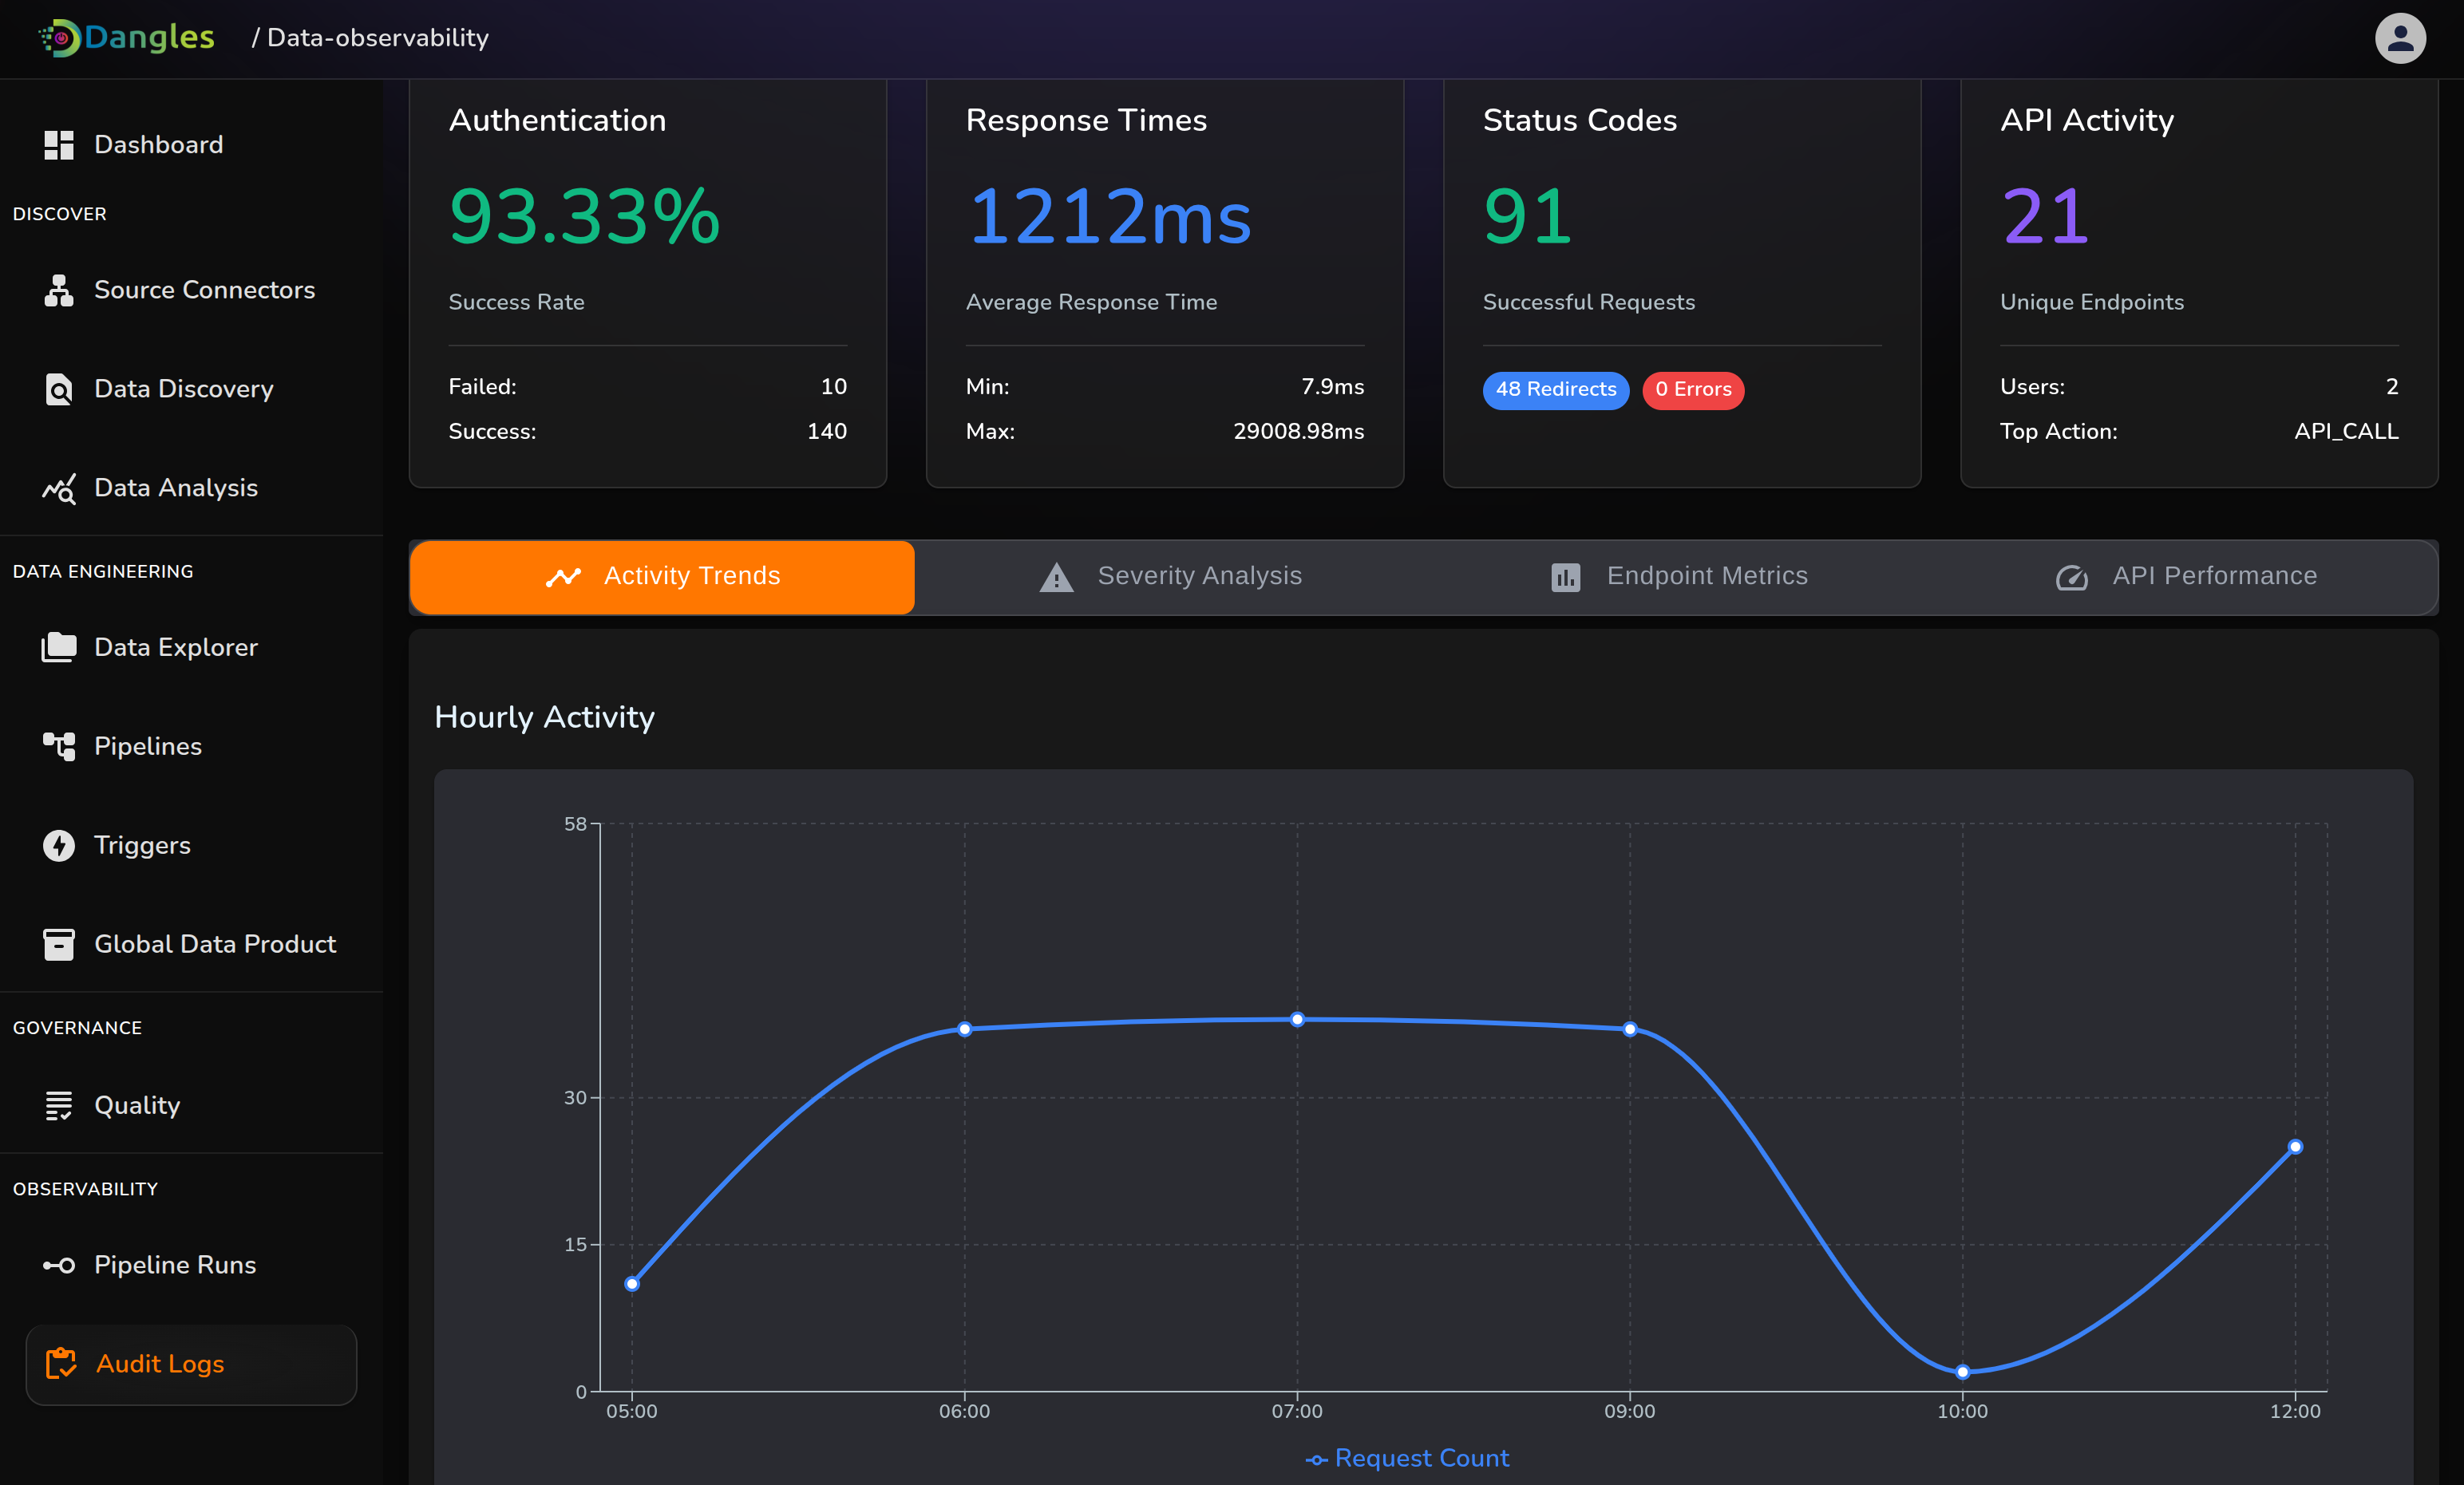
Audit Logs